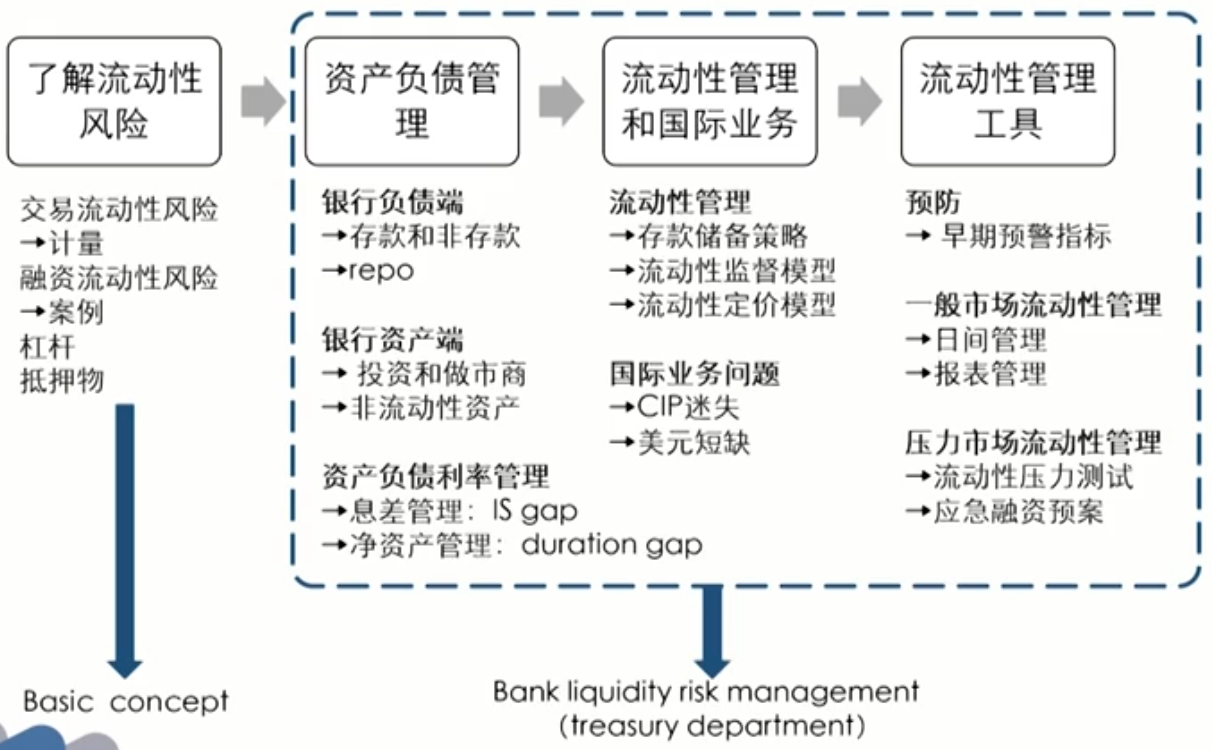
Introduction of Liquidity Risk
Liquidity Risk
Introduction
- Solvency vs. liquidity
- Solvency偿付能力: assets more than liabilities(equity is positive)资产大于负债
- Liquidity流动性: ability of a company to make cash payments as they become due支付现金的能力
- Two type of liquidity
- Transaction liquidity交易流动性: an asset is easy to exchange for other assets.变卖资产
- Funding liquidity融资流动性: is the ability to finance assets continuously at an acceptable borrowing rate.借钱
Sources of liquidity risk
- Transaction liquidity risk(a.k.a. Market liquidity risk or trading liquidity risk): the risk of moving the price of an asset adversely in the act of buying or selling it.
- Transaction liquidity risk is low if assets can be liquidated quickly, cheaply, and without moving the price too much.不能以公允的价格快速变卖资产
- Funding liquidity risk(a.k.a. Balance sheet risk资产负债表差,借不到钱) : the risk that creditors either withdraw credit or change the terms.借不到钱
- Borrower's credit quality is or perceived to be deteriorating and borrower's financial conditions are deteriorating.
- Systemic risk: the risk of a general impairment of the financial system.
- In situations of severe financial stress, the ability of the financial system to allocate credit, support markets in financial assets, and even administer payments and settle financial transactions may be impaired.
- These types of liquidity risk interact.不同风险相互影响
- Funding liquidity risk increases transaction liquidity risk: If collateral requirements or the cost of financing increase,the trader may have to unwind securities.
- Transaction liquidity risk increases funding liquidity risk: If a leveraged market participant have illiquid assets on its books, its funding will be in greater jeopardy.
- Systemic risk increases transaction and funding liquidity risk.
Measuring market liquidity
- Financial institutions can sell the asset at the bid to market maker and buy at the offer from market maker.买卖价差低时市场流动性高
- The market maker is likely to increase the bid-offer spread above a certain size.
- The expected transactions cost is the half-spread or mid-to-bid spread.
- For asset, measure of market liquidity is its bid-offer spread
- Dollar amount: Offer price -Bid price
- Proportional spread: ( Offer price - Bid price ) / Mid market price
- For a book, measuring market liquidity is Cost of liquidation清仓成本
- In normal market conditions:
\text { Cost of liquidation }=\sum_{i=1}^n \frac{1}{2} s_i P_i Q_i =\sum_{i=1}^n \frac{1}{2} \left(\text { offer price }_{{i}}-\text { bid price }_{{i}}\right) P_i Q_i \\ \begin{aligned} & \\ & {s}_{{i}}: \text { proportional spread } \\ & {P}_{{i}}: \text { mid price } \\ & Q_{{i}}: \text { liquidation volume }\end{aligned} - In stressed market conditions:
\text { Cost of liquidation } =\sum_{i=1}^n \frac{1}{2}\left(\mu_i+\lambda \sigma_i\right) P_i Q_i=\sum_{i=1}^n \text{Spread risk factor}_i\times P_i Q_i\\ \begin{aligned}\\ & \mu_i: \text { proportional spread }\\ & {P}_{{i}}: \text { mid price }\\ & Q_{{i}}: \text { liquidation volume }\\ & \sigma_i: \text { standard deviation of proportional spread }\\ & \lambda: \text { critical value under certain confidence level 单尾} \end{aligned}
- In normal market conditions:
- Liquidity-adjusted VaR is regular VaR plus the cost of liquidation.
- In normal market:
V a R+\sum_{i=1}^n \frac{1}{2} s_i P_i Q_i - In stressed market:
V a R+\sum_{i=1}^n \frac{1}{2}\left(\mu_i+\lambda \sigma_i\right) P_i Q_i
- In normal market:
- VaR translation considering market liquidity:
- According to previews knowledge: 假设头寸不变
\text{T-day VaR} =\sqrt{T} \times V a R_{\text {1-day }} - Avoid adverse price impact, the portfolio position equally decreasing every day: T天分批平均清仓,头寸不断减少
\text{Adjusted T-day VaR}=\sqrt{\frac{(1+T)(1+2T)}{6T}} \times \operatorname{VaR}_{\text { 1-day }}
- According to previews knowledge: 假设头寸不变
Funding liquidity risk
- Funding liquidity risk is the risk of financial institution's ability to cannot finance its cash needs as they arise.
- The core function of a commercial bank is to take deposits and provide loans. In doing so, it carries out a liquidity and maturity, as well as credit transformation.
- Maturity mismatch期限错配 leads to funding liquidity risk. To manage funding liquidity risk, bank using asset liability management(ALM).
- Financial institutions that are solvent (i.e., have positive equity) and sometimes fail because of liquidity problems.
- Northern Rock: selling short-term debt instruments for funding, difficult to roll over房价下跌导致减值
- Ashanti Goldfields: selling gold forward, the price of gold jumped up and unable to meet margin calls现货变现慢无法弥补期货亏损
- Metallgesellschaft: long positions in futures, the price of oil fell and there were margin calls石油合同浮盈无法弥补期货亏损
Liquidity challenges
Challenges faced by different institutions
- Commercial banks:
- Bank run挤兑: due to fractional-reserve部分准备金, if depositors are concerned about banks' liquidity, they will endeavor to redeem before other depositors and lenders.
- Security firms券商:
- Lenders abruptly withdrawing credit自营业务挤兑
- Brokerage and clearing customers withdrawing deposits经纪业务挤兑
- Money Market Mutual Funds(MMMF)货币共同基金:
- Sometimes MMMF had to liquidate assets with loss to meet huge redemption. Break the buck phenomenon.
- Hedge funds:
- Hedge fund capital that can be redeemed does not only include which will be expected to experience large losses,but also those profitable or having low losses hedge funds
- No access to wholesale funding and rely on other tools.危机时难以融资
Sources of Liquidity
- Holdings of cash and Treasury securities留现金
- The ability to liquidate trading book positions变卖
- The ability to borrow money at short notice借钱
- The ability to offer favorable terms to attract retail and wholesale deposits at short notice吸收存款
- The ability to securitize assets (such as loans) at short notice证券化
- Borrowings from the central bank向央行借钱
Regulations
- Basel III introduced two liquidity risk requirements: the liquidity coverage ratio(LCR) and the net stable funding ratio(NSFR).
- LCR: High quality liquid assets / Net cash outf lows in a 30-day period ≥ 100%
- NSFR: Available Amount of stable funding / Required amount of stable funding ≥ 100%
- BIS issued 17 principles for sound liquidity risk management.
- Identify the responsibilities, procedures, policies, strategies,information disclosure, supervision etc.
Liquidity black holes
- Also called "crowded exit": a situation where liquidity has dried up in a particular market because everyone wants to do the same type of trade at the same time.所有人都想买/卖,没有对手方
- During the sell-off, liquidity dries up: When positive feedback traders正反馈交易 dominate the trading,market prices are liable to be unstable and the market may become one-sided and illiquid.
- Positive and negative feedback traders
- Negative feedback traders: buy when prices fall and sell when prices rise低买高卖
- Positive feedback traders: sell when prices fall and buy when prices rise追涨杀跌
- Reasons of positive feedback trading
- Trend trading趋势交易
- Stop-loss rules止损原则
- Dynamic hedging动态对冲
- Creating options synthetically期权对冲
- Margins追加保证金被迫平仓
- Predatory trading掠夺性交易,跟着主力走
- Relative value fixed income trade相对价值(LTCM)
Collateral and Leverage
Collateral market
- Collateral plays an important role in credit transactions by providing security for lenders and thus ensuring the availability of credit to borrowers.
- Transactions in collateral market:
- Margin loans保证金贷款
- Repurchase agreements回购
- Securities lending借证券
- Total return swaps总收益互换
- Risks in collateral market transactions:
- Market risk: price fluctuation; interest rate fluctuation
- Credit risk: credit quality of the collateral deteriorates
- Counterparty risk: counterparty may default
Leverage
- Leverage ratio:\mathrm{L}=\frac{A}{E}=\frac{D+E}{E}=1+\frac{D}{E}
- Leverage effect can be seen by writing out the relationship between asset returns r_A, equity returns r_E, and the cost of debt r_D:
- r_E=r_A+\frac{D}{E} \times\left(r_A-r_D\right)
- r_E=L \times r_A-(L-1) \times r_D=r_D+L \times\left(r_A-r_D\right)
- Effect of increasing leverage: \frac{\partial r_E}{\partial L}=r_A-r_D
Leverage itransaction
- margin loans
- Margin lending has a straightforward impact on leverage.
- The haircut determines the amount of the loan that is made:
- Haircut of h percent: (1 - h) is lent against a given market value of margin collateral.
- Leverage of h percent: The leverage on a position with a haircut of h percent is 1/h
- short positions
- Lengthen the balance sheet: since both the value of the borrowed short securities and the cash generated by their sale appear on the balance sheet.
- Increase leverage: both asset and liability increases the same amount with a constant equity.不影响总的杠杆
- derivatives
- Derivative securities are a means to gain an economic exposure to some asset or risk factor without buying or selling it outright.
- Mimic cash position: If the derivative creates a synthetic long (short) position, the economic balance sheet entries mimic those of a cash long (short) position.
- structured credit
- Seniority ranking: Bond tranche > Mezzanine tranche> Equity tranche.
- The equity tranches get the remaining of the asset pool.
Asset Liability Management
Managing Deposit Services and Non-deposit Liabilities
Deposit Services
- Deposit accounts are the number one source of funds at most banks.Two key issues银行最重要的融资渠道:
- Where can funds be raised at lowest possible cost?
- How can management ensure that the institution always has enough deposits to support lending and other services the public demands?
- Main type of deposit services types:
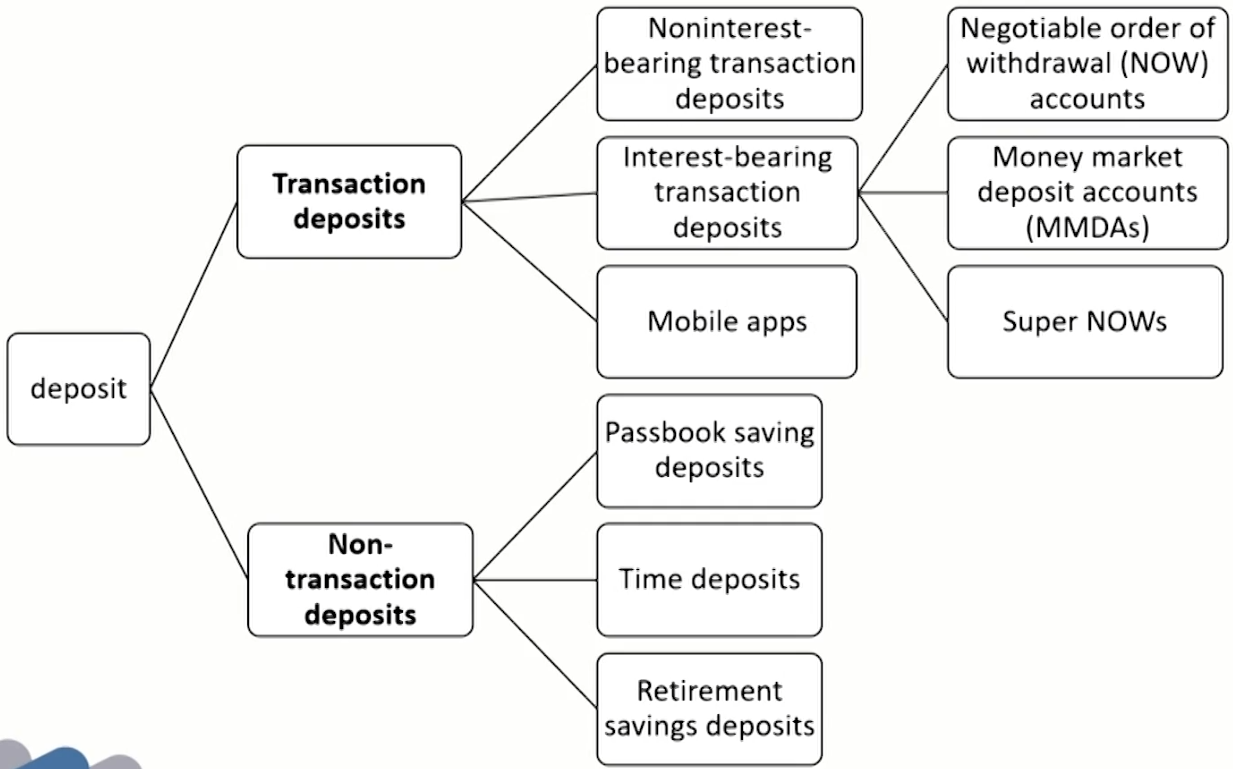
- Transaction(payment or demand) deposits: honor any withdrawals made by the customer immediately.
- Non-transaction(savings or thrift) deposits: Design to attract funds from customers who wish to set aside money for future expenditures or financial emergencies.
Transaction deposits交易性存款
- Noninterest-bearing transaction(demand) deposits无利息
- Do not earn explicit interest but provide the customer with payment service.
- Most volatile and least predictable, and with shortest potential maturity.
- Interest-bearing transaction deposits有利息
- Negotiable order of withdrawal(NOW) accounts.
Hybrid checking-savings deposits没有利息
Give the offering depository institution prior notice before the customer withdraws funds取钱前要提前通知
Held only by individuals and nonprofit institutions主要是个人和非盈利机构 - Money market deposit accounts (MMDAs)
Flexible money market interest rates but accessible via check or preauthorized draft to pay for goods and services.利率高
Up to six preauthorized drafts and three withdrawals be made by writing checks per month.限制支取次数
Can be held by businesses as well as individuals. - Super NOWs
No limitation on the number of checks depositor write不限制支取
Offers institutions post lower yields on SNOWs than on MMDAs.利率低于MMDAs
Can be held by individuals and nonprofit institutions.
- Negotiable order of withdrawal(NOW) accounts.
- Mobile apps
- The hottest item in the transaction deposit field today appears to be the mobile check deposit.
Non-transaction deposits非交易性存款
- Passbook saving deposits
- Unlimited withdrawal privileges不限制支取 and low interest rate低利率
- Tend to be stable with little sensitivity to changes in interest rates.
- Individuals, nonprofit organizations, governments, and business firms can hold savings deposits
Businesses could not place more than $150,000 in the United States
- Time deposits定期存款
- Provide to wealthier depositors with fixed maturity dates and fixed or sometimes fluctuating rates.
- Must carry a minimum maturity of 7 days.
- Most popular of all time deposits is certificates of deposits(CDs)最受欢迎
Negotiable CD and nonnegotiable CD.
- Retirement savings deposits退休存款
- Wage earners and salaried individuals工薪阶层: individual retirement account (IRA) grant the right to make limited tax-free contributions each year.
- Self-employed persons个体户: Keogh plan retirement account is available.
- Both IRAs and Keoghs are highly stable最稳定 and carries fixed interest rate固定高利率, which are great appeal for managers of depository institutions.
Pricing Deposits
- An important issue remains: How should depository institutions price their deposit and deposit services in order to attract new funds and make a profit?
- Need to pay a high enough interest return to attract customer funds but must avoid paying an interest rate so costly that it erodes any potential profit margin
- Deposits and Services Pricing Methods
- Marginal Cost
- Cost plus profit margin
- Conditional Pricing
- Relationship pricing
Deposits Pricing Methods
- Marginal Cost息差收益
- Definition: the added cost of bringing in new funds.
\begin{align} &\text{Marginal cost rate} =\frac{\text { Change in total cost }}{\text { Additional funds raised }} \\ &\text{Change in total cost}= \text{New interest rate}\times\text{Total funds raised at new rate} - \text{Old interest rate}\times\text{ Total funds raised at old rate} \end{align} - Profit maximum: \text{marginal revenue rate} = \text{marginal cost rate}
- Definition: the added cost of bringing in new funds.
Services Pricing Methods
- Cost plus profit margin人工费、服务器费等
- Each deposit service may be priced high enough to recover
all or most of the cost of providing that service. - Calculate formula:
\begin{align} &\text{Unit price charged the customer for each deposit service} \\ =& \text{Operating expense per unit of deposit service经营成本} \\ +&\text{Estimated overhead expense allocated to deposit service管理成本} \\ +&\text{Planned profit margin from each service unit sold赚的利润} \end{align}
- Each deposit service may be priced high enough to recover
- Conditional Pricing
- The customer pays a low fee or no fee if the deposit balance remains above some minimum level but faces a higher fee otherwise.收费少但对账户余额有要求
- Varies among deposits based on one or more factors as follows:
The number of transactions
The average balance
The maturity of the deposit - Flat-rate pricing固定费率
The depositor's cost is a fixed charge per check, per time period, or both. - Free pricing无费率
No monthly account maintenance fee or per-transaction charge.
Unprofitable for institutions because it tends to attract many small, active deposits when market rate is high.吸引小额资金 - Conditionally free pricing余额多就免费
Favors large-denomination deposits because services are free if the account balance stays above some minimum figure.
- Relationship pricing绑定服务越多,费率越低
- Promotes greater customer loyalty提高忠诚度
- makes the customer less sensitive对收费不再敏感 to the prices posted on services offered by competing financial firms.
Challenges Of Offering Deposit Accounts (Cont.)
- Deposit insurance存款保险
- 供保机构:Federal Deposit Insurance Corporation(FDIC) provides deposit protection for its membership.
- 免责范围:U.S. government securities, shares in mutual funds, safe deposit boxes, and funds stolen from an insured depository institution.
- 保费制定:determined by the volume of deposits and the degree of risk exposure.
- Disclosure of deposit service存款信息披露
- Advertising of deposit terms may not be misleading.
- Deposit rates must be quoted as annual percentage yields(APY).
- The dates and minimum balance required must be explicit.
- The depositor must be warned of penalties or fees that could reduce the yield.
Overdraft protection透支保护
- Definition: This service makes sure that clients' incoming checks and draft are paid and clients avoid excessive NSF(not sufficient funds) fees.允许有一定透支额度开超出余额的支票,透支的费用有利息
- Provide customers convenience but like predatory lending掠夺性
- High actual interest rate利率高: Important source of income for financial-service provider.
- Being criticized: Faced with adverse public and regulators' comments, some financial firms have reduced or eliminated their overdraft fees.
Basic(Lifeline) Banking生命线银行
- Controversial social issue
- Depository institutions are asked to offer low-cost financial services, especially deposits and loans, for customers unable to afford conventional services.给有需要的人基本金融服务(水电费等)提供低成本
- Controversial for service provider:
- Low price cannot cover cost收不抵支: Most financial-service providers are privately owned corporations and responsible to their shareholders to earn profit.
- Regulation problem监管问题: banking industry is regulated and are not treated in public policy like other private firms.
- Controversial for solving the issue:
- How to decide which customers access to low-price services?如何确定哪些人有需要
- Insist on imposing a means test on customer?如何持续判断客户情况
- Someone must bear the cost of producing services but who?谁来承担支出
Sources of Non-deposit Liabilities非存款负债
- When deposit is inadequate to support loans and investment,financial institutions need non-deposit liabilities:
- Federal Funds Market (Most popular domestic source)同业拆借市场: Consist exclusively of deposits held at the Federal Reserve banks and can be transferred through Fed wire通过联邦电汇网络拆借.
- Meet legal reserve requirements为了满足法定存款准备金的需求 and satisfy loan demand
- Large banks play a role similar to funds brokers.
- Short-term borrowings:
Overnight loans: Normally no collateral无合同
Term loans: longer-term Fed loans contract
Continuing contract: automatically renewed each day
- Borrowing from Federal Reserve Banks向央行借款: Fed will make the loan through its discount window通过贴现窗口借钱 by crediting the borrower's reserve account. The loan must be backed by acceptable collaterals有抵押.
- Primary credit信用质量好才能借: short terms(overnight to 90 days), a higher interest rate than Fed funds interest rate.利率比同业拆借高
- Secondary credit信用差一点: depository institutions not qualifying for primary credit, a higher interest rate than primary credit.利率更高一点
- Seasonal credit季节性的: longer periods than primary credit, for small and medium-sized institutions experiencing seasonal swings.应对季节性业务
- Advances from Federal Home Loan Banks联邦住房贷款
- 目标: Improves the liquidity of home mortgages and encourages more lenders to provide credit to the housing market.鼓励发房贷
- 提供纾困抵押贷款:Allows troubled institutions to use the home mortgages as collateral for emergency loans.房贷作为抵押物向央行借款
- 贷款利率低于市场利率:A stable source of funding at below-market interest rates.
- 期限范围广:Ranges from overnight to more than 20 years
- The large Negotiable CDs大额存单市场
- A hybrid复合 account: a deposit or another form of IOU借条.
- Short maturity: range from 7 days to 1 or 2 years but concentrated in the 1-to 6-month.
- 到期本息和的计算: Amount due CDs = Principal × (1 + Annual interest rate x Days to maturity / 360 days)
- The Eurocurrency Deposit Market欧洲货币市场
- How to borrow and lend Eurocurrencies: A domestic financial firm can tap the Euromarkets for funds by contacting one of the major international banks that borrow and lend Eurocurrencies every day. The largest U.S. bank use their own overseas branches tap the market.
- The largest unregulated监管少 financial market-place in the world.
- Commercial Paper market商业票据市场
- Short-term notes: 3 or 4 days to 9 months, sell at discount
- Industrial paper: designed to finance the purchase of inventories or raw materials and to meet other immediate cash needs of nonfinancial companies.
- Financial paper: issued by finance companies and the affiliates of financial holding companies.
Purchase off-book loans of other financial firms in same organization, giving these firms funds to make new loans.
- Repurchase Agreements回购
- Less popular than Fed funds and more complex.
- Most domestic Repos are transacted across the Fed Wire system, just as are Fed funds transactions.
- A bit longer time to transact than a Fed funds loan.
- Repo transaction is often for overnight funds, but it may be extended for days, weeks, or even months.
- Long-term non-deposit funds长期非存款基金
- Beyond one year: 5 to 12 years mortgages, capital notes and debentures.
- Favorable leveraging effect有杠杆: made it attractive to larger financial firms.
- More sensitive: Tend to be a sensitive barometer of the perceived risk exposure.
Non-deposit Funding Choice
- In using non-deposit funds, funds managers must answer the following key questions:
- How much in total must be borrowed from these sources to meet funding needs? (Available Funds Gap)
- Which non-deposit sources are best, given the borrowing institution's goals? (The relative costs, risk, length of time, size of the institution, regulations limits.)
- Available Funds Gap(AFG)
- Calculation formular:
\begin{align} &\text{Available funds gap (AFG)} \\ =&\text{Current and projected loans and investments the lending institution desires to make} \\ -&\text{Current and expected deposit inflows and other available funds} \end{align} - Small amount add to AFG: cover unexpected credit demands or unanticipated shortfalls in inflow funds.
- Calculation formular:
- Factors of choosing alternative non-deposit sources
- The relative costs of raising funds from each source.融资成本
Effective cost rate: determine how much each source of borrowed funds costs. 总成本/可投资资金 - The risk(volatility and dependability) of each funding source融资风险
Interest rate risk利率风险: The volatility of credit costs, the shorter the term of the loan, the more volatile the prevailing market interest rate tends to be.
Credit availability risk资金可得性: Negotiable CD, Eurodollar, and commercial paper markets are especially sensitive to credit availability risks. - The length of time (maturity or term) for which funds are needed.
Some funds sources, such as commercial paper and long-term debt capital may be difficult to access immediately.借款速度
Term or maturity of the funds need plays a key role as well.资金期限 - The size of the institution that requires funds.融资规模
The standard trading unit for most money market loans is $1 million.
The Fed funds and central bank's discount window can make small denomination loans for smaller firms. - Regulations limiting the use of alternative funds sources.监管限制
Federal and state regulations may limit the amount,frequency, and use of borrowed funds.
In the United States CDs must be issued at least 7 days
The Federal Reserve banks may limit borrowings from the discount window, particularly by depository institutions that appear to display significant risk of failure.
Other forms of borrowing may be subjected to legal
reserve requirements by action of the central bank.
- The relative costs of raising funds from each source.融资成本
Overall cost of funds calculation
- The relative costs of raising funds from various sources including deposits
- Historical average cost approach(look at the past)历史平均成本
Weighted average interest expense
Break-even cost (cover the operating and interest cost)
Weighted average overall cost of capital - Pooled-funds approach(look at the future)资金池子
Pooled deposit and nondeposit funds expense rate
Hurdle rate
- Historical average cost approach(look at the past)历史平均成本
- Historical average cost approach
- A bank needs to raise fund for future loans, it asks what funds the financial firm has raised to date and what they cost:
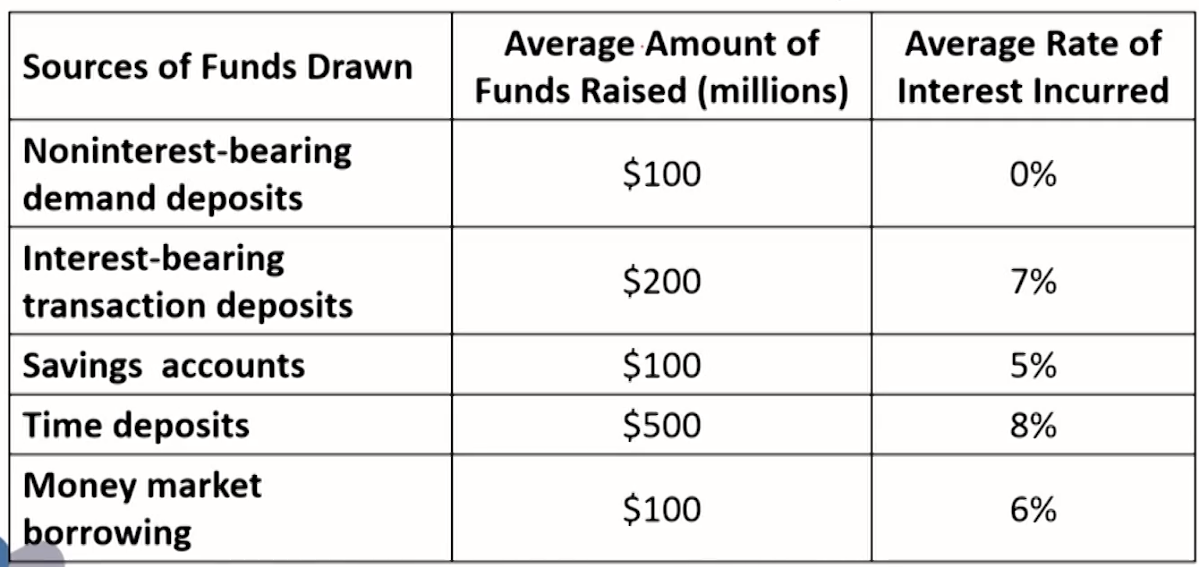
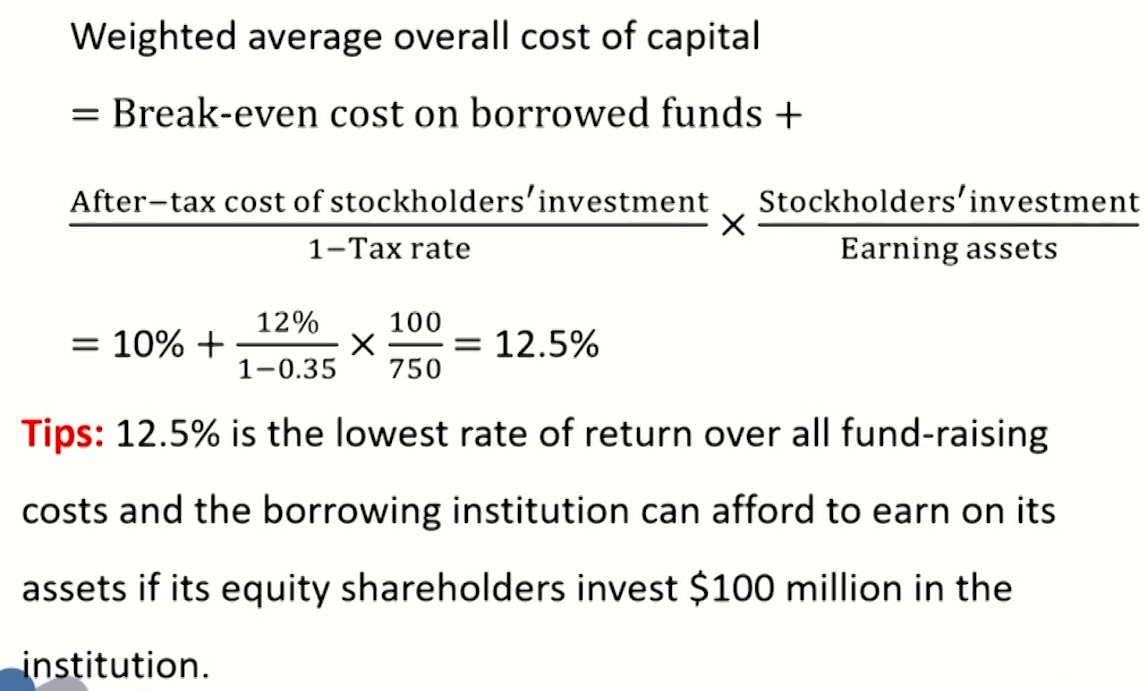
- Assumed the operating costs is $10 million and all earning assets is $750 million, what is the weighted average interest expense and break-even cost rate on borrowed funds invested in earning assets? Assumed the required rate of return of $100 million investment from stockholders is 12%after tax(tax rate is 35%), what is the weighted average overall cost of capital?
- Answer
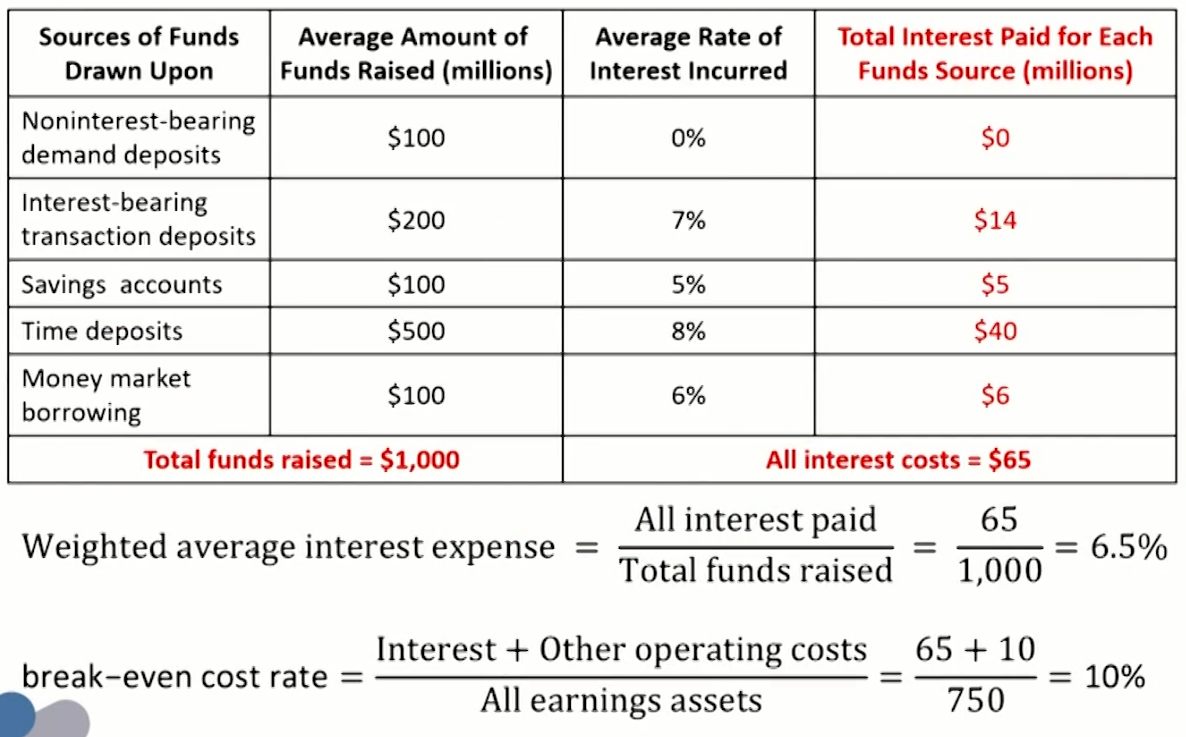
- A bank needs to raise fund for future loans, it asks what funds the financial firm has raised to date and what they cost:
- Pooled-funds approach
- A bank needs to raise for future loans. Suppose the estimate for future funding sources and costs is as follows:
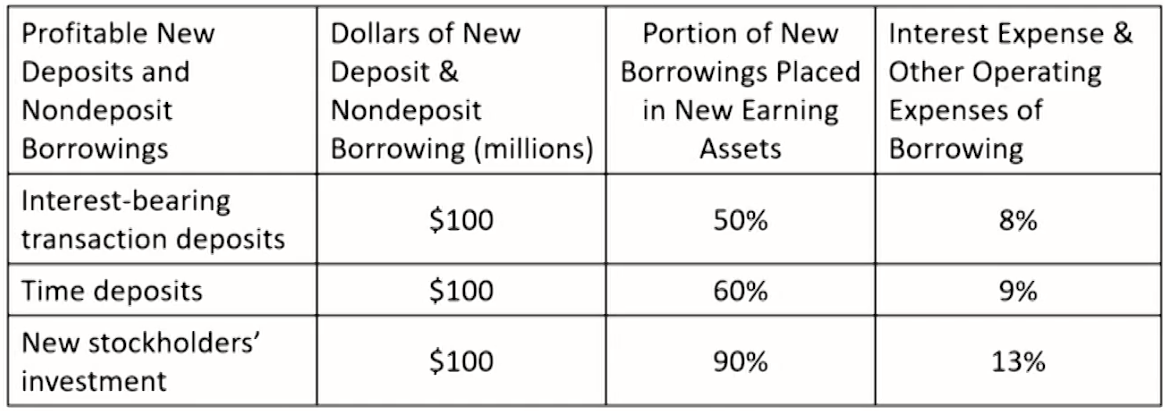
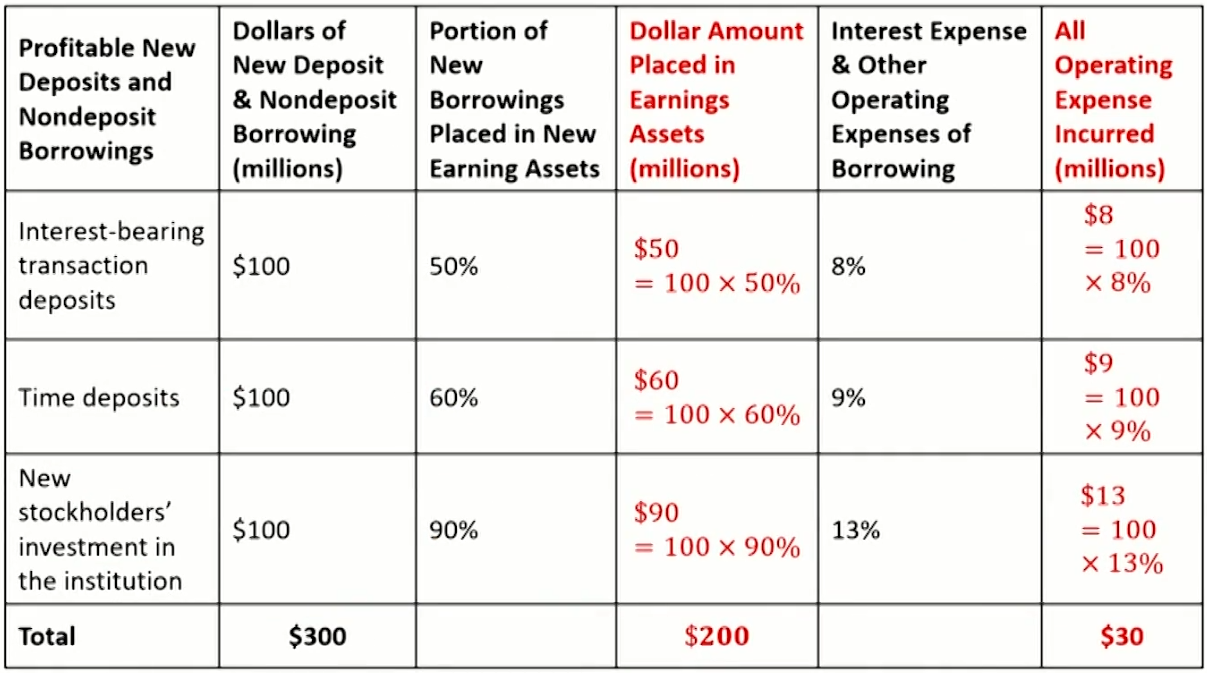
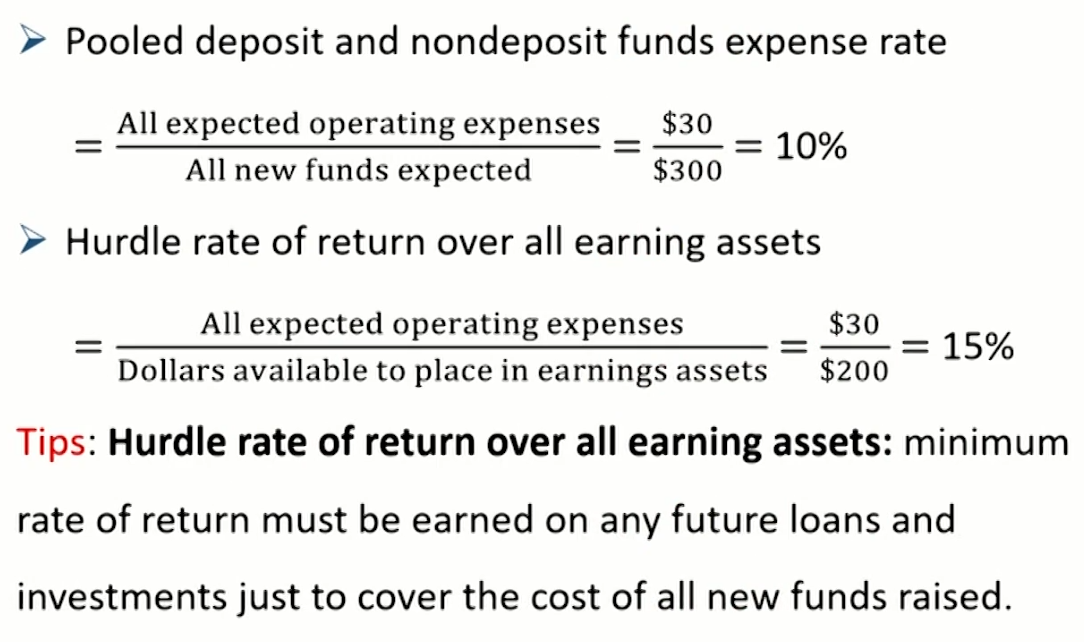
- What is the Pooled deposit and non-deposit funds expense rate and what is the hurdle rate of return over all earning assets?
- Answer
- A bank needs to raise for future loans. Suppose the estimate for future funding sources and costs is as follows:
Repurchase Agreements And Financing
Repurchase Agreements Introduction
- A contract in which a security is traded at some initial price with the understanding that the trade will be reversed at some future date at some fixed price.
- Repo rate: actual/360, simple rate
- Repo haircut: difference between the purchase price of the securities and the amount borrowed from the repo.
- Collateral: investors care about the quality of the collateral
- Margin call: borrower supplies extra collateral in declining markets but may withdraw collateral in advancing markets.
- Repurchase Agreements calculation
- Interest cost of Repo = Amount borrowed × Repo rate × Number of days in Repo borrowing / 360 days
- Amount borrowed(cash inflow) = collateral securities full price(invoice price) x (1 - haircut)
- Cash outflow = Amount borrowed + Interest cost of Repo
Common motivations for investing repo
- Buy the repo/ enter into reverse repo/ invest in repo: lender of cash in repo market
- Professional investors often want to short a bond.
- Bet the interest rates will rise
- Bet that the price of another security will rise relative to the price of the security being sold short.
- Investors holding cash for liquidity or safekeeping purposes often find investing in repo to be an ideal solution.
- Money market mutual fund industry: invests on behalf of investors willing to accept low returns in exchange for liquidity and safety.
- Municipalities市政当局: These tax revenues cannot be invested in risky securities, but neither should the cash collected lie idle灵活性强
Common motivations for selling repo
- Repos and Long Financing
- Sell the repo/enter into repo: borrowers of cash in repo markets.借钱
- Financing for proprietary positions/customers positions.
- Finance inventory for the purpose of making markets.
open repo: a one-day repo that renews itself day-to-day until cancelled by either party.
Back-to-back repo连环回购
- Repos and Liquidity Management
- Firms balance the costs of funding against the risks of being caught without the financing necessary to survive.
Repo markets are relatively liquid
Repo borrowing rates relatively low
Short maturities repo is on the less stable side of the funding spectrum, although more stable than short-term,unsecured borrowing like commercial paper. - risk
Counterparty risk: borrower defaults and the collateral's value turns out to be insufficient to cover the loan amount. Overnight repo and high quality collateral is preferred
Liquidity risk: the value of the collateral declining in fire sales. Can be mitigated by haircut
- Firms balance the costs of funding against the risks of being caught without the financing necessary to survive.
General and special repo rates
- Repo trades can be divided into those using general collateral (GC) and those using special collateral or specials.
- GC rates are for overnight repo where any U.S. Treasury collateral is acceptable. 一般抵押物
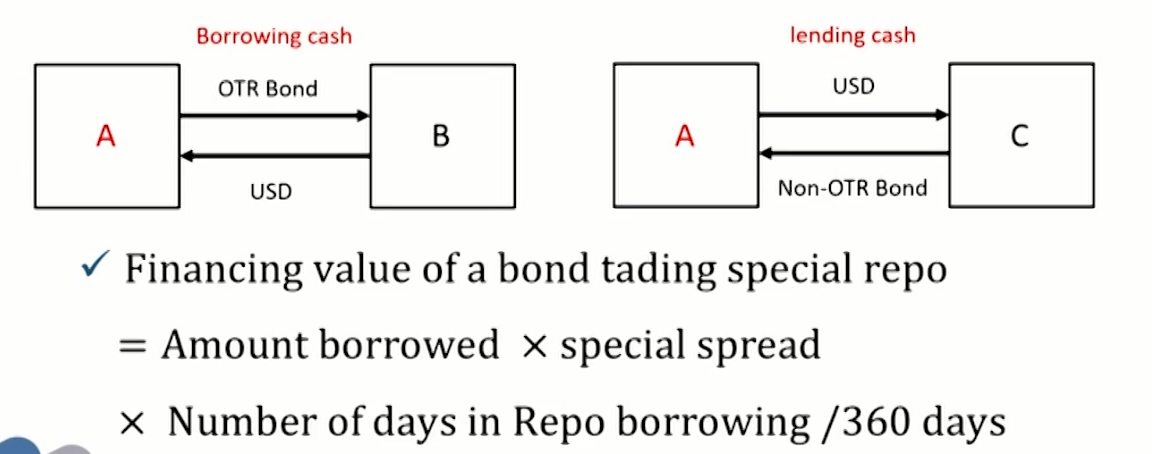
- Special rates are for repo being able to borrow cash at a relatively low rate with special securities as collateral. 特殊抵押物
- Special rate is less than更低 the GC rate
- Special spreads = GC rates - Special rates
- Special collateral:
- Special rates determined by the demand of borrowing that issue to that date relative to the supply available.
- On-the-run(OTR) or current issue: The most recently issued bond of a given maturity最新发行的
- At each maturity, the OTR trades the most special,followed by the old次新, the double-old次次新.
- Why OTR securities tend to trade special: liquid is special流动性高导致逆回购方愿意放弃部分收益
- OTR tend to be the most liquid: Extra liquidity of newly issued Treasuries makes them ideal candidates not only for long positions but for shorts.
- Self-fulfilling phenomenon: everyone expects a recent issue to be liquid.
- Four characteristics of special spreads:
- Quite volatile: spreads are volatile on a daily basis
- Quite large: spreads of hundreds of basis points are quite common.
- Higher levels over some periods: Special spreads do attain higher levels over some periods rather than others.
- Small immediately after auctions and to peak before auctions: The supply of high liquid bond is high after auctions and low before auctions.拍卖前达到峰值
- Financing value of a bond: over the entire life of the bond,borrow cash at its special rate, and invest that cash at the higher GC rate.
The Investment and dealer Function In Financial-services Management
Investment instruments
- To examine the different investment vehicles available, divide into two broad groups:
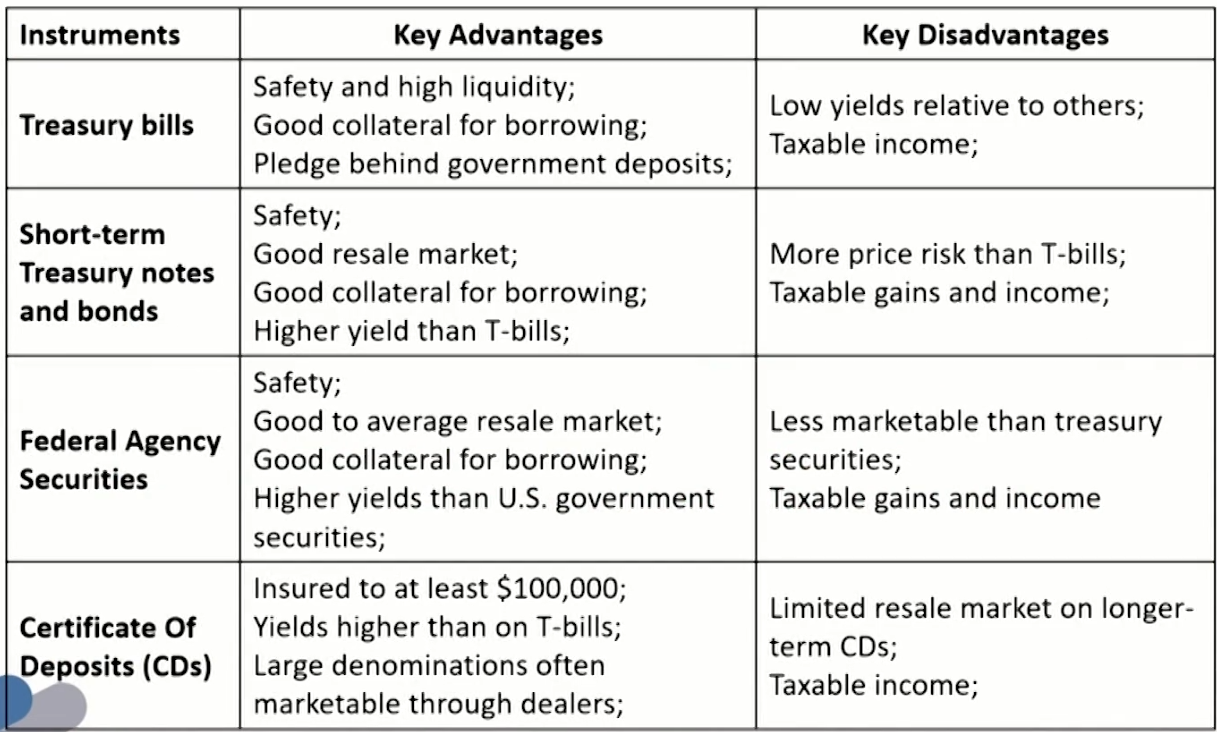
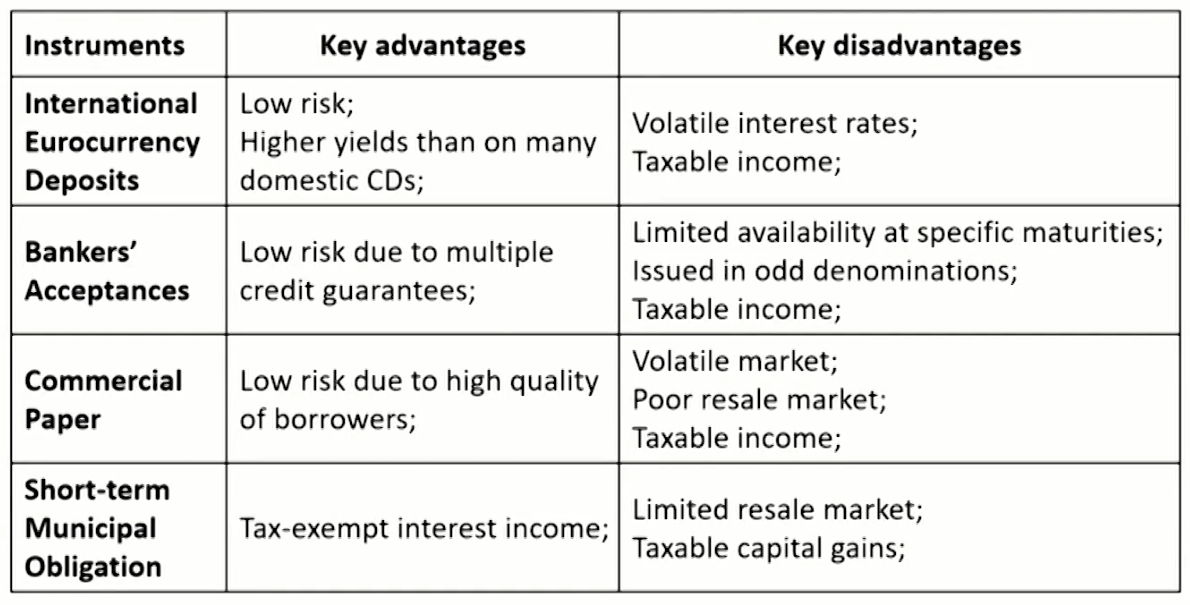
- Money market instruments: maturity within one year, low risk and ready marketability.
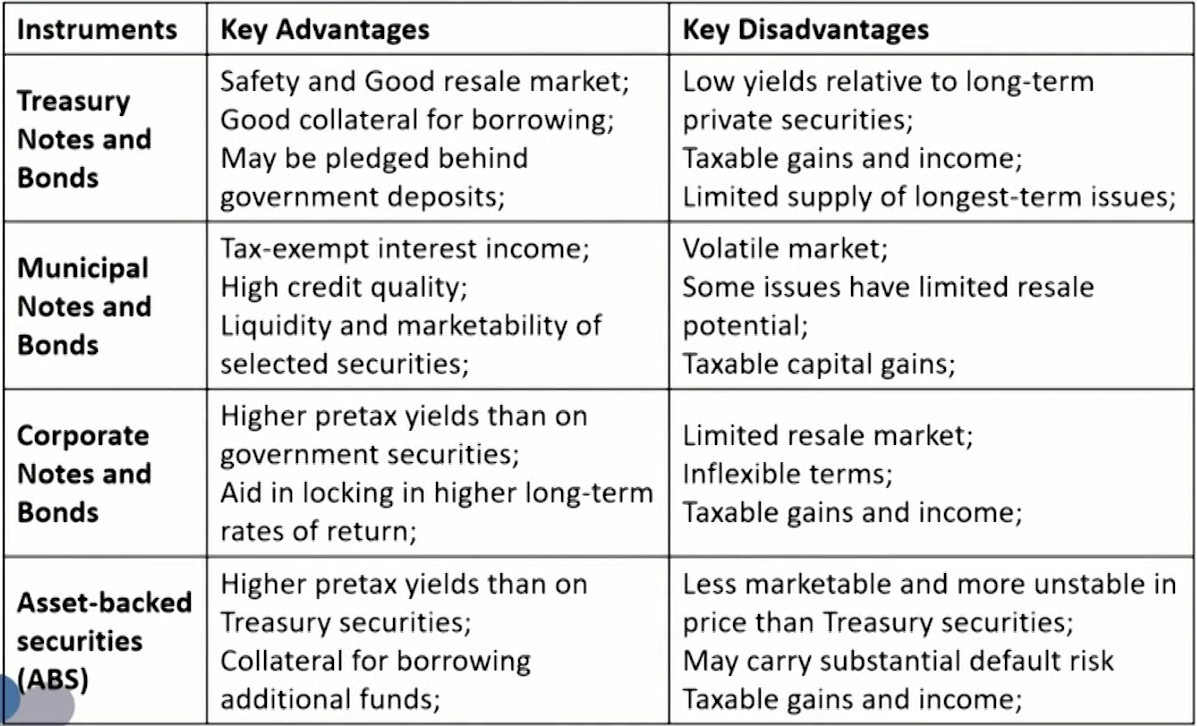
- Capital market instruments: maturities beyond one year, higher expected rate of return and capital gains potential.
- Money market instruments
- Capital market instruments
Factors affecting choice of investment securities
- Expected Rate of Return
- YTM(if held to maturity) & holding period yield(HPY)
- Tax Exposure
- After-tax rate of return on loans and securities
- Tax swap tool: lending institution sells lower-yielding securities at a loss to reduce taxable income and purchase new higher-yielding securities to boost future returns.出售亏损标的,买入新资产
In years when loan revenues are high, it may be beneficial to engage in tax swapping.贷款收入高时税多 - Portfolio Shifting Tool(考虑Tax and higher return):
第一种操作: sell off selected securities at a loss
Result: offset loan income and reduce tax liability
第二种操作: shift portfolios to substitute new, higher-yielding securities for old security whose yields may be below current market levels. 买高收益证券,卖收益低的证券,当前亏损未来收益
Result: take substantial short-run losses in return for the prospect of higher long-run profits.
- Pledging Requirements
- Depository institutions in the United States cannot accept deposits from federal, state, and local governments unless they post collateral acceptable to these governmental units to safeguard public funds.
- Usually federal and municipal securities国债市政债 can meet government pledging requirements.
- Risk
- Credit or Default Risk
- Liquidity Risk
- Call Risk
- Inflation Risk
- Prepayment Risk
- Business risk
- Interest Rate Risk: Periods of rising (declining) interest rates are often marked by surging (decreasing) loan demand.
Investment maturity strategies
- Once the investments officer chooses the type of securities,there remains the question of how to distribute those security holdings over time.
- The ladder(or Spaced-Maturity)
- Strategy: divide investment portfolio equally among all maturities.

- Advantage: reduces investment income fluctuation/require little management expertise.
- Strategy: divide investment portfolio equally among all maturities.
- The front-end load maturity policy
- Strategy: all security investments are short-term.
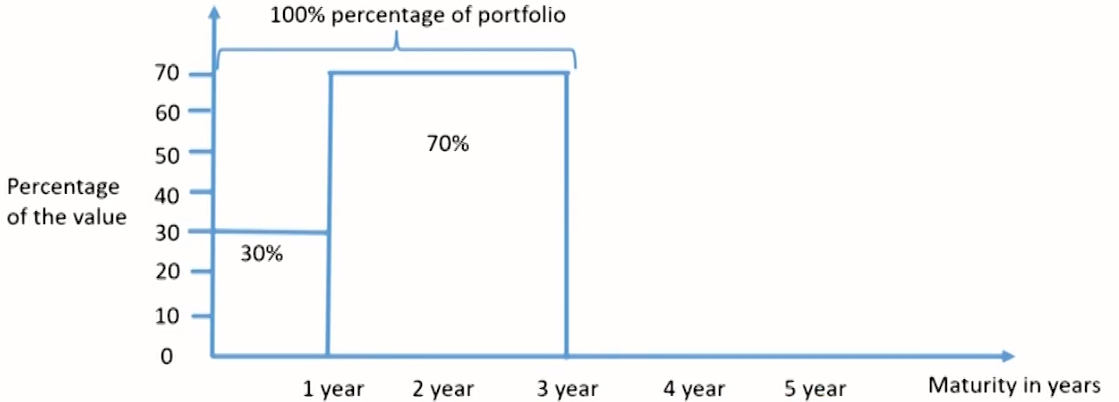
- Advantage: strengthens the financial firm's liquidity position and avoids large capital losses if market interest rate rise.
- Strategy: all security investments are short-term.
- The back-end load maturity policy
- Strategy: all security investments are long-term.
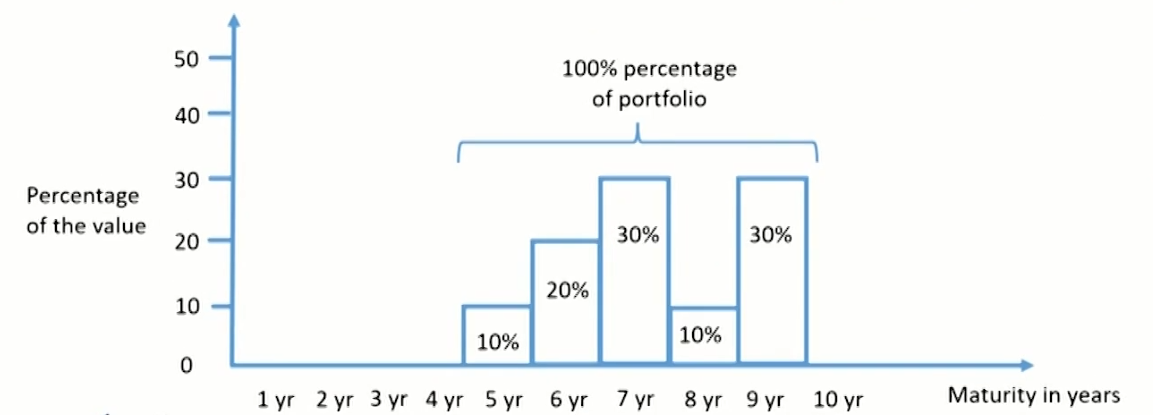
- Advantage: maximizes income potential from security investments if market interest rate fall.
- Strategy: all security investments are long-term.
- The barbell investment portfolio strategy
- Strategy: security holdings are divided between short-term and long-term.

- Advantage: meet liquidity needs and achieve earnings goals.
- Strategy: security holdings are divided between short-term and long-term.
- The rate-expectations approach
- Strategy: change the mix of investment maturities as the interest rate outlook changes.

- Advantage: maximizes the potential for earnings (and also for losses).
- Strategy: change the mix of investment maturities as the interest rate outlook changes.
Maturity management tools
- The yield curve: a picture of how market interest rates differ across loans and securities of varying term (time) to maturity.
- Forecast interest rates and the economy
- Show current trade-offs between returns and risks
- Measure how much might be earned currently by pursuing the carry trade短融长投
- Riding the yield curve strategy: when the yield curve's slope is steep enough, buy the longer-term security (higher YTM) and hold until its tenor decreases (lower YTM), then sell it.
- Duration: present-value-weighted measure of maturity of an individual security or portfolio of securities.
- Immunization of interest rate risk and reinvestment risk offset each other:
- Duration of an individual security or a security portfolio is set equal to the investing institution's planned holding period.
Major lines of business of dealer banks
- Intermediate in Securities dealing, underwriting, and trading
- Dealer的基础业务:Intermediate in the primary market between issuers and investors of securities and in the secondary market among investors
- Risk factors: short-term funding like repo
- Trade in over-the-counter derivatives
- For most over-the-counter derivatives trades, one of the two counterparties is a dealer.
Running matched book: aim to lay off much or all the risk of its positions by offset trades and made profits from the differences between bid and offer terms. - Proprietary trading in over-the-counter derivatives markets
- Risk factors: Contingent payments risk & Counterparty risk
- For most over-the-counter derivatives trades, one of the two counterparties is a dealer.
- As Prime brokerage to hedge funds and other large investors
- 主经纪商业务:Provides services including management of securities holdings, clearing, cash-management services,securities lending, financing, and reporting
- 盈利方式:Generates additional revenues by lending securities that are placed by prime-brokerage clients
- Dealer banks have large asset-management divisions
- Cater to the investment needs of institutional and wealthy individual clients.
- Prime brokerage and asset management
- Risk factors: The dealer bank's liquidity position is weakened if large clients exit their positions or enter new positions to offset their risk.
- Systemic liquidity crisis
Failure mechanisms
- "Run-on-the-bank": The key mechanisms that lead to the failure of a dealer bank:
- The flight of short-term creditors
- The departures of prime-brokerage clients
- Cash-draining actions by derivatives counterparties
- Loss of clearing-bank privileges
- The flight of short-term creditors流动性枯竭
- Dealer bank融资来源:
Bonds and commercial paper
Short-term repos - During financial crisis, repo rollover becomes difficult.
The dealer may be forced to sell its assets in a hurry,resulting in much lower prices. Lower price leads to further fire sales for others, causing a systemic risk.
- Dealer bank融资来源:
- The way to mitigate the risk of flight of short-term creditors
- Establishing lines of bank credit贷款承诺
- Dedicating a buffer stock of cash and liquid securities for emergency liquidity needs留现金
- "Laddering" the maturities of its liabilities so that only a small fraction of its debt must be refinanced within a short period of time.
- The departures of prime-brokerage clients客户出逃
- Clients' balances: The prime broker can use clients' cash balances to meet the immediate cash demands of another.
- Rehypothecation: Margin loans for a dealer bank can also be financed using the client's own assets as collateral,through "rehypothecation."
- Clients' departures: If clients do leave without notice, their cash and securities are not in the pool, forcing dealer banks to use its own cash to meet liquidity needs.
- Cash-draining actions by derivatives counterparties对手方抽干资金
- If a dealer bank is in a solvency crisis, OTC counterparty would look for opportunities to reduce exposure to that dealer bank.
Borrow from the dealer
Enter new trades that cause dealer to pay out cash
Seek to harvest cash from any derivatives positions - The way to mitigate the risk: Central clearing counterparty
- If a dealer bank is in a solvency crisis, OTC counterparty would look for opportunities to reduce exposure to that dealer bank.
- Loss of cash settlement privileges无法使用透支特权
- Daylight overdraft privileges: Under normal conditions,clearing bank extend "daylight overdraft privileges" to creditworthy clearing customers.
- Refuse the privileges: The clearing bank may refuse to process transactions that are insufficiently funded by the dealer bank's cash fund account when the solvency of a dealer bank is questioned.
Policy responses to alleviate dealer's risk
- Capital injections: central banks and by capital injections into dealer banks.
- Most important source of systemic risk is the potential impact of dealer-bank fire sales on market prices and investor portfolios.
- Higher capital requirements: capital are likely to be higher for
- derivatives that are not guaranteed by a central clearing counterparty.
- Central-bank insurance for tri-party repos: Short-term tri-party repos are a particularly unstable source of financing in the face of concerns over a dealer's solvency.
- Central clearing: Threat by flight of OTC derivatives counterparties can be lowered by central clearing.
- Pre-failure resolution: such as distress-contingent convertible debt of dealer banks are important for those are suffering grievous financial distress.
Illiquid Asset
Characteristics of illiquid markets
- Illiquidity: infrequent trading, small amounts being traded,low turnover
- Most asset classes are illiquid:
- Equity(OTC)未上市股票: a weekor more
- Municipal bond市政债: annual turnover of less than 10%
- Real estate房地产: 4-5 years
- Institutional infrastructure基础设施: 50 years or longer
- Works of art艺术品: 40-70 years
- Markets for Illiquid Assets Are Large: the total wealth held in illiquid assets exceeds the total wealth in traditional, liquid stock, and bond markets.
- Investor Holdings of Illiquid Assets: for individual investors, 90% total wealth is illiquid asset.
- Human capital is the largest and least liquid asset for many individual investors.
- High net worth individuals always hold 10-20% in treasure assets.
- University endowments, pension funds, and other institutional investor also allocate much more on this asset kind.
- Liquidity Can Dry Up: In stressed economic periods, liquidity can dry up.
- Illiquidity crises occur regularly because liquidity tends to dry up during periods of severe market distress.
Illiquid asset markets
- Source of illiquidity: illiquidity arises due to market imperfections
- Participation costs学习成本: investors must spend money, time, or energy to learn and gain necessary skills (capital, expertise,experience).
- Transaction costs交易成本: commissions, taxes, due diligence, title transfer, etc.
- Search frictions信息成本: need to search to find an appropriate buyer or seller.
- Asymmetric information信息不对称: one investor has superior knowledge compared with others so that other investors become reluctant to trade because concerning about fraud.
- Price impact价格冲击: large trades will move markets.
- Funding constraints资金有限: access to credit is impaired
Biases on reported returns
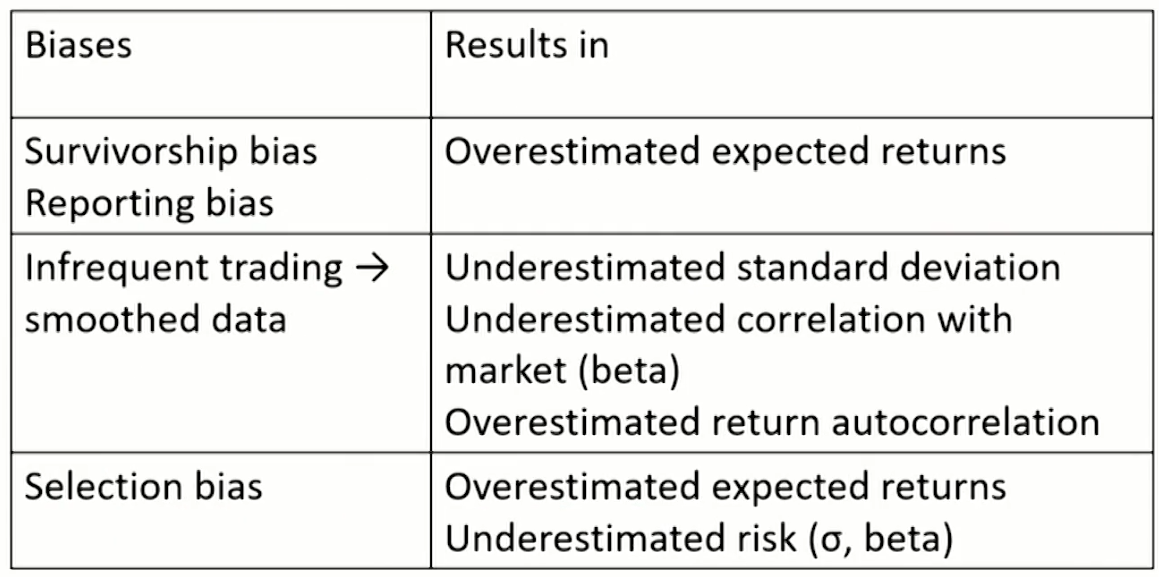
- Survivorship bias幸存者偏差: results from the tendency of poorly performing funds to stop reporting.
- True illiquid asset returns are worse than the reported data.
- Reporting bias报告性偏差: occurs when fund never achieves a sufficiently attractive returns, they don't start reporting returns in the first place.
- Overestimate the expected return
- Infrequent trading不频繁交易,自相关系数高估
- Return volatilities are underestimated.
- Correlations with market (other assets) and betas are underestimated.
- Returns for these infrequently traded assets are smoothed
- Selection bias选择偏差: Asset values and returns tend to be reported when they are high. Sample selection bias results in overestimated expected returns and underestimated risk as measured by beta and the standard deviation of returns.
- Buildings: many sellers postpone sales until property values recover
- Private equity: The venture capitalist tends to sell a small company, when the company's value is high and the transaction is recorded.
Summary of biases on reported returns
Illiquidity risk premiums
- Illiquidity risk premiums: compensate investors for the inability to access capital immediately.
- Allocation across asset classes(e.g. real estate)
- Choose securities within an asset class that are more illiquid
- Act as market maker at the individual security level
- Rebalancing
- There is an evidence of large illiquidity risk premiums within asset classes.
- Within asset classes: take long positions in illiquid assets and short positions in liquid ones.
U.S.Treasuries: on-the-run/off-the-run
Corporate Bond: Larger bid-ask spreads and infrequent trading led to higher yields in corporate bond markets.
Equity: many illiquidity variables predict returns in equity markets, with less liquid stocks having higher returns.
- Within asset classes: take long positions in illiquid assets and short positions in liquid ones.
- Why illiquidity risk premiums manifest within but not across asset classes?
- Limited integration across asset classes: investors put asset classes into different silos and rarely treat them as a whole.
Liquidity providing activities
- Market making做市: A market maker supplies liquidity by acting as an intermediary between buyers and sellers.
- Liquidity provision is costly: Investors transacting with the market maker pay the bid-ask spread.
- Rebalancing调仓: the simplest way to provide liquidity, as well as the foundation of all long-horizon strategies.
- Rebalancing forces asset owners to buy at low prices when others want to sell.
- Since rebalancing is counter-cyclical, it supplies liquidity.
Portfolio choice with illiquid assets
- Investors face many considerations on how much of their portfolios to devote to illiquid assets:
- Investors have different horizons
- Illiquid market don't have tradable indices难对冲
- Talented active portfolio managers are needed (agency issues)
- How to evaluate and monitor portfolio managers
Risk Management For Changing Interest Rates
Asset-liability Management Strategy
- A balanced approach, also called funds management strategy.
- Manage both assets and liabilities in order to achieve the financial institution's goals.
- Interest rate risks faced by financial institutions affect both the balance sheet(Net worth) and the statement of income and expenses(Net interest margin).
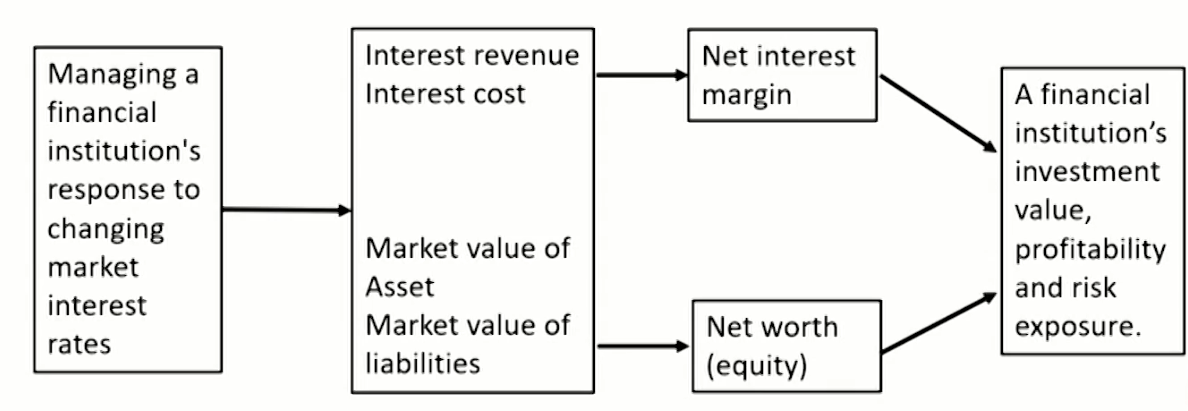
Net interest margin
- Formular
\text{NIM}=\frac{\text{Net interest income}}{\text{Total earning assets}}=\frac{\text{Interest income} -\text{Interest expense}}{\text{Total earning assets}}- Interest income from loans and investments
- Interest expense from deposits and other borrowed funds
- Types of assets and liabilities
- Repriceable (interest-sensitive) assets/liabilities
Variable-rate loans and securities etc - Nonrepriceable assets/liabilities
Fixed interest rate loans etc. - Net interest income
\begin{align} &\text{Total interest income}=Y_{\text{ISA}} \times Q_{\text{ISA}}+Y_{\text {Non ISA }} \times Q_{\text {Non ISA }} \\ &\text{Total interest cost}=Y_{ \text{ISL }} \times Q_{\text{ISL}}+Y_{\text {Non ISL }} \times Q_{\text {Non ISL }} \end{align}
- Repriceable (interest-sensitive) assets/liabilities
Interest-sensitive Gap
- Interest-Sensitive Gap management
- Interest-sensitive gap(IS GAP) = Interest-sensitive assets (ISA) - Interest-sensitive liabilities(ISL)
Relative IS GAP = IS GAP / Size of financial institution
Interest Sensitivity Ratio(ISR) = ISA / ISL - Asset-sensitive(positive) gap: ISA -ISL > 0
Liability-sensitive(negative) gap: ISA - ISL < 0
Zero interest-sensitive gap
- Interest-sensitive gap(IS GAP) = Interest-sensitive assets (ISA) - Interest-sensitive liabilities(ISL)
- Aggressive GAP management利润最大化

- Defensive Interest-Sensitive Gap management
- Set interest-sensitive GAP as close to zero as possible to reduce the expected volatility of net interest income.
- Limitation of Interest-sensitive Gap management
- Changes inconsistent: Interest rates paid on liabilities tend to move faster that interest rates earned on assets.
- Basis risk: The interest rates attached to assets of various kinds often change by different amounts and at different speeds than many of the interest rates attached to liabilities.
- Net worth is not considered.
Duration Gap management
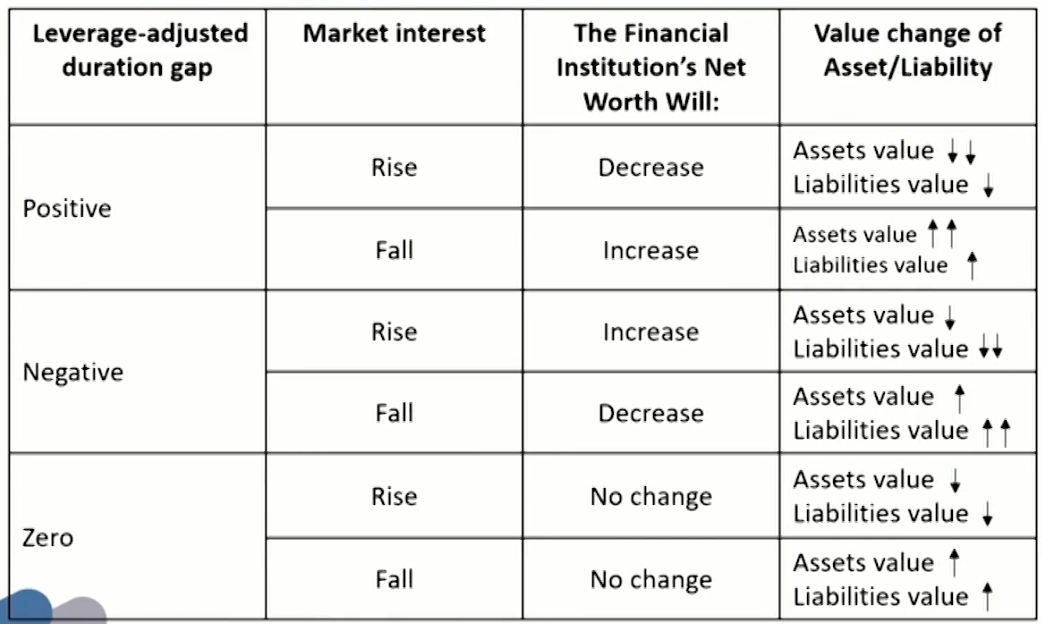
- Duration analysis can be used to stabilize , or immunize, the market value of a financial institution's net worth (NW).
- NW = Assets - Liabilities
- A rise in market rates of interest will cause the market value (price) of both fixed-rate assets and liabilities to decline.
- Price sensitivity to interest rates changes and duration
\begin{align} &\frac{\Delta P}{P} \approx-D * \frac{\Delta i}{(1+i)} \\ &\Delta \mathrm{NW}=\Delta A-\Delta L=\left[-D_A \times \frac{\Delta i}{(1+i)} \times A\right]-\left[-D_L \times \frac{\Delta i}{(1+i)} \times L\right]= -\left[D_A-D_L \times \frac{L}{A}\right] \times \frac{\Delta i}{(1+i)} \times A \end{align}- D: Macaulay duration
- D_A,D_L: Dollar-weighted duration
- D_A-D_L \times \frac{L}{A}: Leverage-adjusted duration gap
- Strategies
- Portfolio immunization strategy:Leverage-adjusted duration gap equals to zero
- Take chance to maximize the shareholders' position

- Limitation of Duration Gap management
- Leverage-adjusted duration gap equals to zero is difficult:
Hard to find assets and liabilities of the same duration that fit into a financial-service institution's portfolio. - Neglect convexity impact:
Only consider linear relationship, Major changes in interest rate does not apply
The accuracy and effectiveness of duration gap management decreases when there are major changes in interest rates.
- Leverage-adjusted duration gap equals to zero is difficult:
Liquidity Management and Global Banking Issue
Liquidity And Reserves Management: Strategies And Policies
The demand-supply framework
- Five sources of fund demand
- Customers withdrawing money from their accounts
- Credit requests from customers
- Repayment of borrowings
- Dividend payment to shareholders
- Other operating expenses
- Five sources of fund supply
- New customer deposits: the most important source
- Customers repaying their loans
- Sales of assets
- Selling non-deposit services
- Borrowings in the money market
- Net liquidity position
{L}_{{t}}= \text{Supplies of liquidity} - \text{Demands of liquidity}- L_t\lt0: Liquidity deficit
- L_t\gt0: Liquidity surplus

Strategies for liquidity management
- Asset liquidity management strategies有盈余就买资产,缺钱就卖
- Definition: Also called asset conversion strategies, this strategies tend to store liquidity in assets, predominantly in cash and marketable securities.
- Main users: smaller financial institutions
- Pros: less risky than relying on borrowings
- Cons: high opportunity cost because investing in liquid assets means forgoing higher returns on other assets that might be acquired.
- Borrowed liquidity management strategies缺钱就借钱
- Definition: Also called liability management strategies or purchased liquidity strategies, this strategies have chosen to raise more of their liquid funds through borrowings in the money market.
Purest form: calls for borrowing immediately spendable funds to cover all anticipated demands for liquidity - Main users: largest banks
- Pros:
Lowering opportunity cost
Leave assets portfolio unchanged, higher expected return
Offer different rates to meet different funds needed - Cons: the most risky approach due to volatility of interest rates and the rapidity with which the availability of credit can change.
- Definition: Also called liability management strategies or purchased liquidity strategies, this strategies have chosen to raise more of their liquid funds through borrowings in the money market.
- Balanced liquidity management strategies预期到的靠卖资产,未预期到的靠借钱
- Definition: expected liquidity demands are stored in assets (marketable securities) and advance arrangements for lines of credit. Unexpected cash needs are met by near-term borrowings.
- Pros: Strike a balance between risk and opportunity cost.
Estimating liquidity needs
- Sources and uses of funds approach根据资金使用和来源估计

- Estimating future deposits and loans divides the forecast of future deposit and loan growth into three components: trend component, seasonal component, cyclical component
- The structure of funds approach分类估计各来源
- Total liquidity requirement = Deposit and non-deposit liability liquidity requirement + loan liquidity requirement
- Deposit and non-deposit liability liquidity requirement: deposits and other funds are divided into categories based upon their estimated probability of being withdrawn:
\begin{align} \text{Liability liquidity reserve}=&0.95\times(\text{Hot money deposits and non-deposit funds}-\text{Required legal reserve}) \\ +&0.30\times(\text{Vulnerable deposit and nondeposit funds}-\text{Required legal reserve}) \\ +&0.15\times(\text{Stable deposits and non-deposit funds}-\text{Required legal reserve}) \end{align}
"Hot Money" liabilities (often called volatile liabilities)热钱
Vulnerable funds易损资金
Stable funds (often called core deposits or core liabilities)稳定资金 - Loan liquidity requirement: 100% satisfy customers needs.
\text{Loan liquidity requirement}=(\text{Potential loans outstanding}-\text{Actual loans outstanding})
Once the customer is sold a loan, the lender can proceed to sell that customer other services to establish a multidimensional relationship.
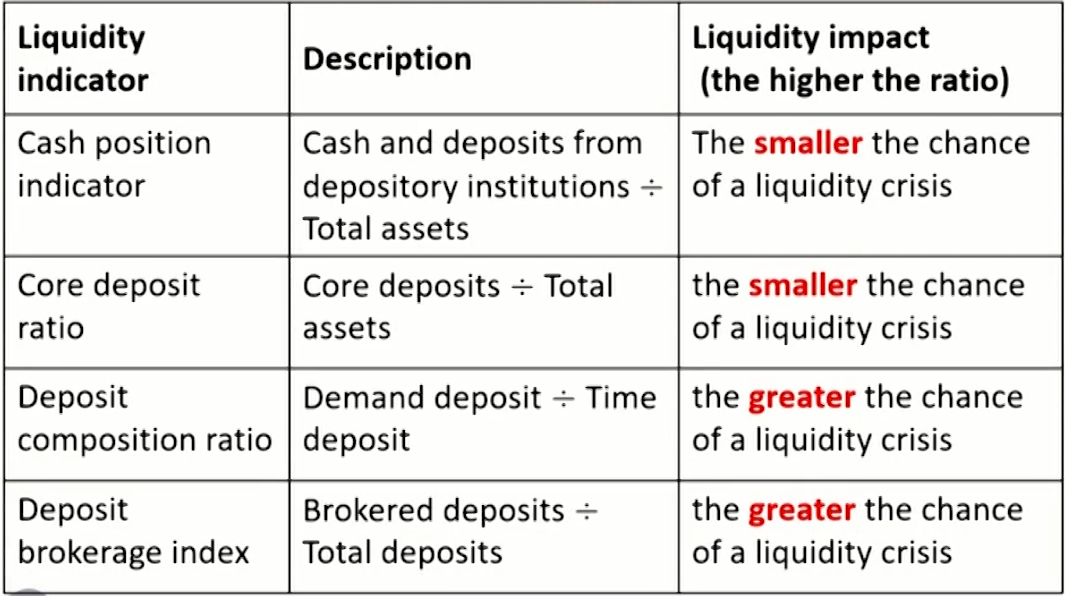
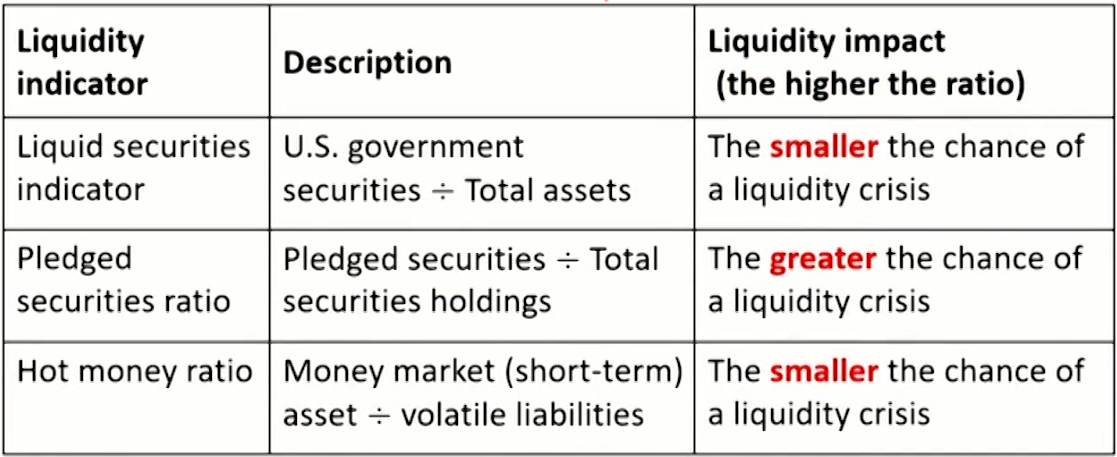
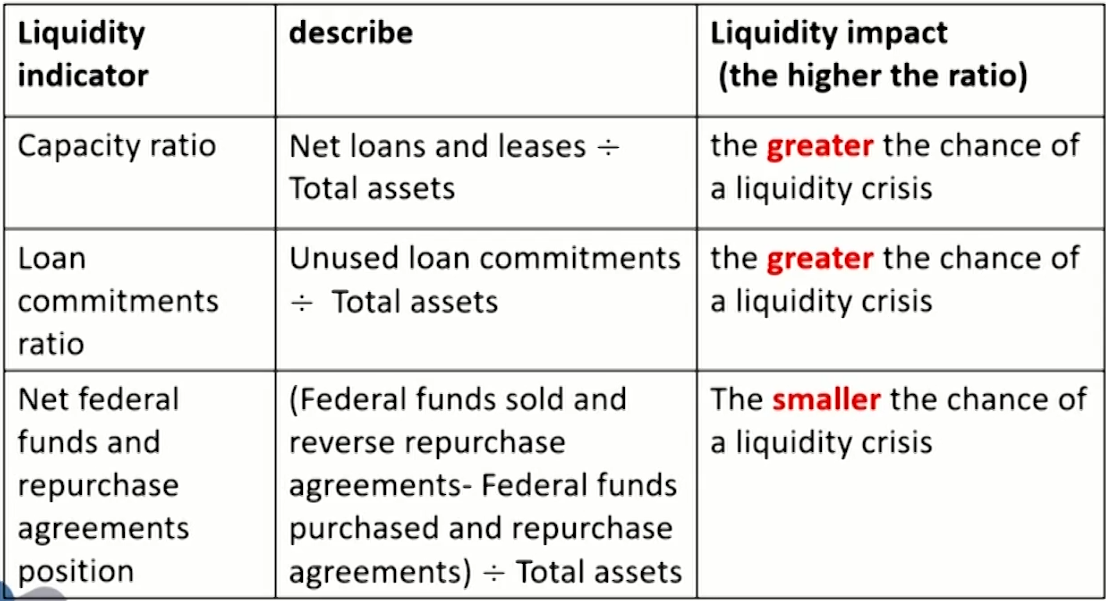
Refine the structure of funds approach by calculating expected liquidity requirements based on probabilities of different possible outcomes. - Liquidity indicator approach根据流动性指标
Many financial-service institutions estimate their liquidity needs based upon experience and industry averages,which means using certain liquidity indicators.
存款类
证券类
贷款
Legal Reserves
- Lagged reserve accounting (LRA) is used to calculate Legal Reserves.

- Reserve computation period: two-week period from a Tuesday through a Monday two weeks later.
- Reserve maintenance period: 14-day period stretching from a Thursday through a Wednesday.
- Reserve funding period: reserve maintenance begins 30 days after the beginning of the reserve computation, which allow money position manger 16 days to plan.
- Total required legal reserves
- Reserve requirement on transaction deposits × Daily average amount of net transaction deposits over the computation period
- Reserve requirement on non-transaction reservable liabilities × Daily average amount of non-transaction reservable liabilities over the computation period
- Alternative sources of reserves:
- Federal funds market
- Selling liquid securities
- Drawing upon any excess correspondent balances placed with other depository institutions
- Repo
- Selling new time deposits to the largest customers
- Borrowing in the Eurocurrency market
- Central bank's discount window
- Factors in choosing among the different sources :
- Immediacy of need
- Duration of need
- Access to the market for liquid funds
- Relative costs and risks of alternative sources of funds
- The interest rate outlook
- Outlook for central bank monetary policy
- Rules and regulations applicable to a liquidity source
Monitoring Liquidity
Liquidity options
- Definition: give the right of a holder to receive cash from or to give cash to the bank at predefined times and terms.
- Credit line sells to customer: the obligor has the right to withdraw whatever amount up to the notional of the line.客户有权利支取现金
- Customer's reasons of exercise
Provide beneficial financing rate
Generate cash flow conveniently
- Customer's reasons of exercise
- Sight and saving deposits: the bank's clients can typically withdraw all or part of the deposited amount with no or short notice.客户有权利支取之前的储蓄存款
- Customer's reasons of exercise
Invest in assets with higher yields
Liquidity need for transaction purposes
- Customer's reasons of exercise
- Prepayment of fixed rate mortgages: the bank's client has the right to repay the funds before the contract end.客户有权利提前还贷
- Customer's reasons of exercise:
Divorces or retirements
Financial incentive to close the contract and reopen it under current market conditions.
- Customer's reasons of exercise:
Impact of liquidity options
- A liquidity impact on the balance sheet, given by the amount withdrawn or repaid.
- Negative impact on bank liquidity positions: Credit line sells to customer ; Sight and saving deposits
- Positive impact on bank liquidity positions: Prepayment of fixed rate mortgages
- A positive or negative financial impact, given by the difference between the contract's interest rates and the market rate at the time the liquidity option is exercised.
A taxonomy of cash flows
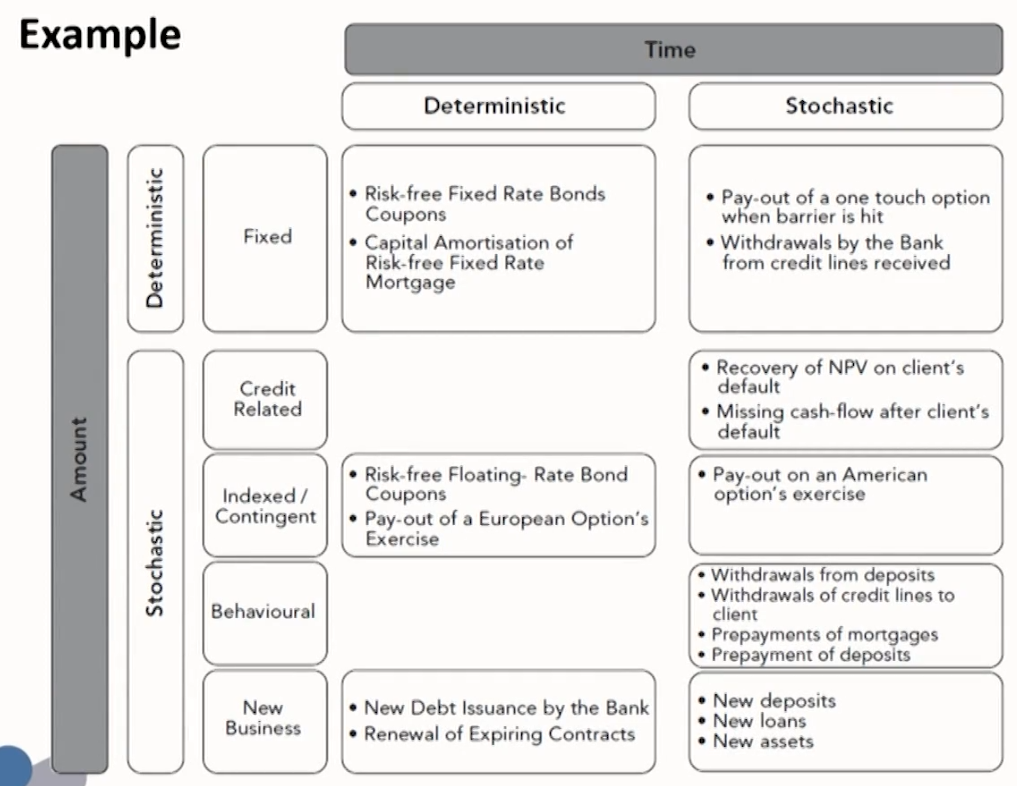
- The taxonomy focuses on two main dimensions: time and amount. We can further classify these two dimensions as deterministic and stochastic.
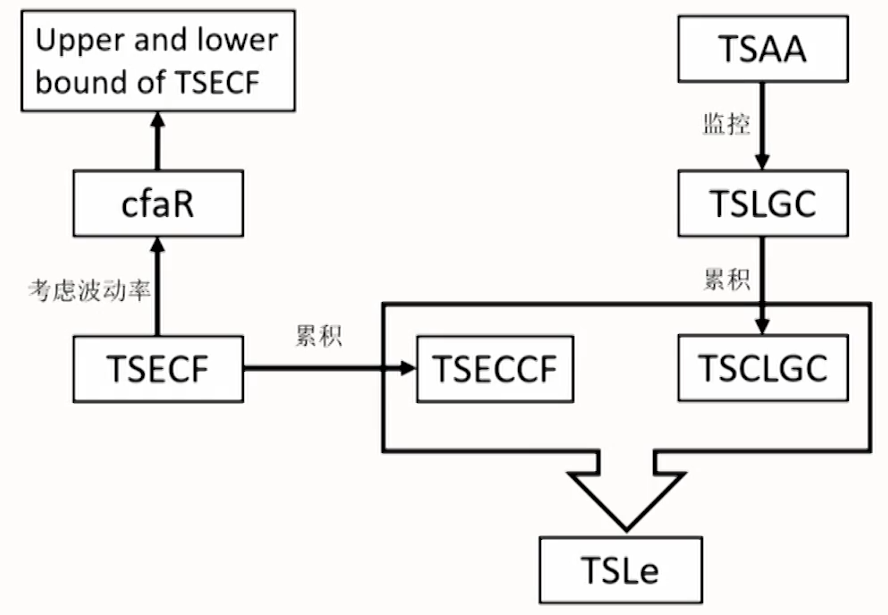
- The term structure of expected cash flows预期现金流
- Definition: TSECF can be defined as the collection, ordered by date, of expected cash flows, up to expiry referring to the contract with the longest maturity.
- The term structure of expected cumulated cash flows预期累计现金流
- Definition: TSECCF is the collection of expected cumulated cash flows ordered by date: Represents how the past dynamic evolution of net cash flows affects its total cash position on that date.
- Liquidity generation capacity流动性生产能力
- Definition: LGC is the main tool a bank can use to handle the negative entries of the TSECCF.
- The ability of a bank to generate positive cash flows,beyond contractual ones, from the sources of liquidity available in/off the balance sheet at a given date.
- Three types of sources of liquidity:
Selling of Assets (AS)
Secured funding using assets as collateral:Repo transactions (RP)
Unsecured funding (USF):Withdrawals of committed credit lines available from other financial institutions;Deposit transactions in the interbank market
- The term structure of LGC
- Definition: TSLGC as the collection of liquidity that can be generated at a given time, by the sources of liquidity, at the reference time up to a terminal time.
- The term structure of expected liquidity
- Definition: TSLe is basically a combination of the TSECCF and the TSCLGC. TSLe is in practice a measure to check whether the financial institution is able to cover negative cumulated cash flows at any time in the future, calculated at the reference date.
- TSLe represents the main monitoring tool of a Treasury Department.
- The term structure of available assets
- Definition: TSAA is a tool used to monitor a bank's LGC and to provide an indication of the extent to which an asset can be used to create liquidity.
- Only shows how many single securities are available for inclusion in LGC. Does not imply that the notional amount of securities can be fully converted into liquidity.
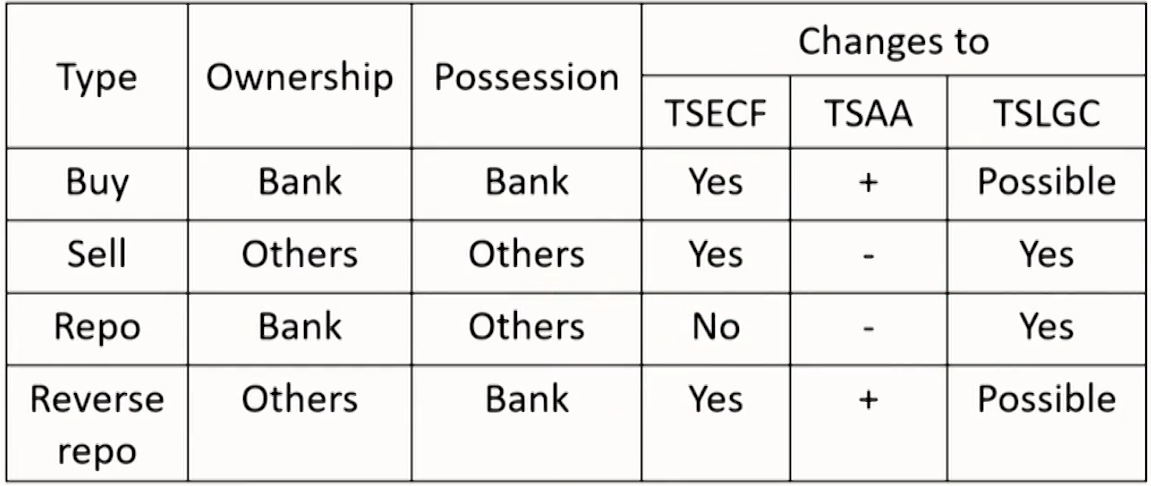
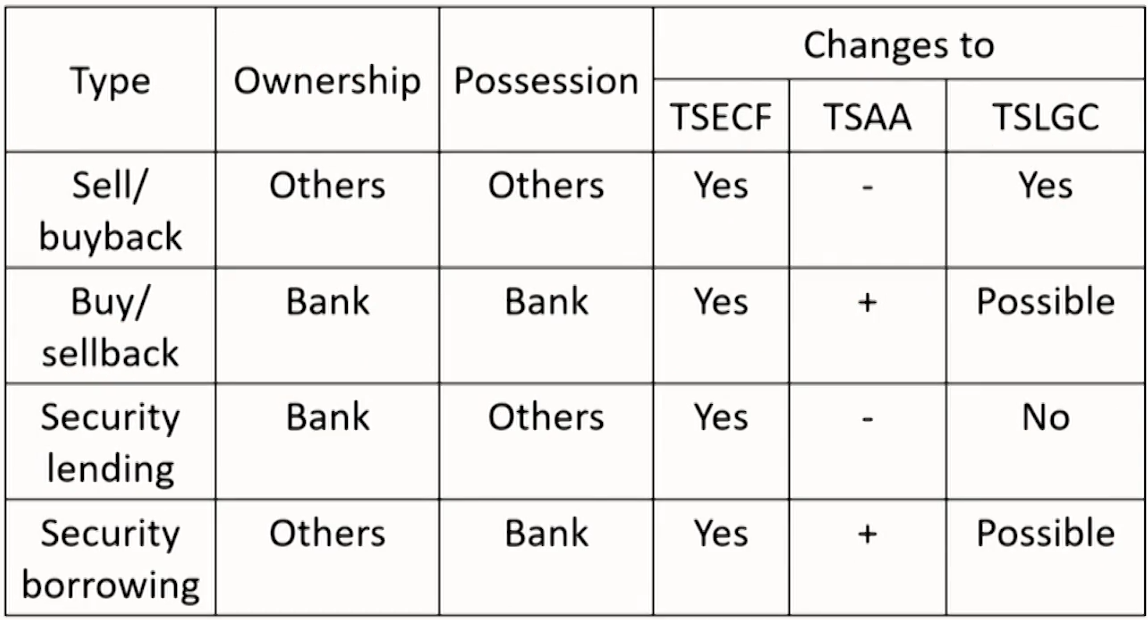
- Transactions affectTESCF/TSAA/TSLGC
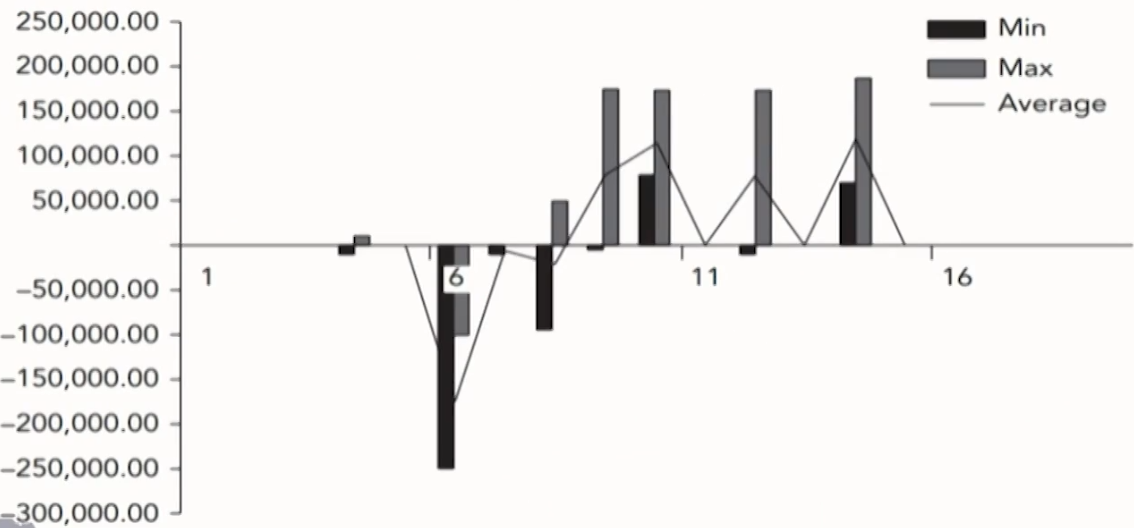
Cash flows at risk(cfaR)
- Cash flows are stochastic: not only the expected value but also its volatility.
- Cash flows at risk: showing the extreme values that both positive and negative cash flows assume during the time of their occurrence.
- Positive cash flow at risk :
\operatorname{cfaR}_\alpha^{+}\left(\mathrm{t}_0, \mathrm{t}_{\mathrm{i}}\right)=\mathrm{cf}_\alpha^{+}\left(\mathrm{t}_0, \mathrm{t}_{\mathrm{i}} ; \mathrm{x}\right)-\mathrm{E}\left[\mathrm{cf}\left(\mathrm{t}_0, \mathrm{t}_{\mathrm{i}} ; \mathrm{x}\right)\right] - Negative cash flow at risk :
\mathrm{cfaR}_{1-\alpha}^{-}\left(\mathrm{t}_0, \mathrm{t}_{\mathrm{i}}\right)=\mathrm{cf}_{1-\alpha}^{-}\left(\mathrm{t}_0, \mathrm{t}_{\mathrm{i}} ; \mathrm{x}\right)-\mathrm{E}\left[\mathrm{cf}\left(\mathrm{t}_0, \mathrm{t}_{\mathrm{i}} ; \mathrm{x}\right)\right] - \mathbf{x}: risk factors such as credit, behavioral and market variables e.g. interest rate
- \alpha: confidence level e.g. \alpha=99\%
- Positive cash flow at risk :
Liquidity Transfer Pricing:A Guide Better Practice
Introduction of LTP
- Liquidity Transfer Pricing(LTP) is a process that attributes the costs, benefits and risks of liquidity to respective business units within a bank.
- Purpose of LTP
Transfer liquidity costs and benefits from business units to a centrally managed pool
Recoups the cost of carrying a liquidity cushion by charging contingent commitments. - Process of LTP
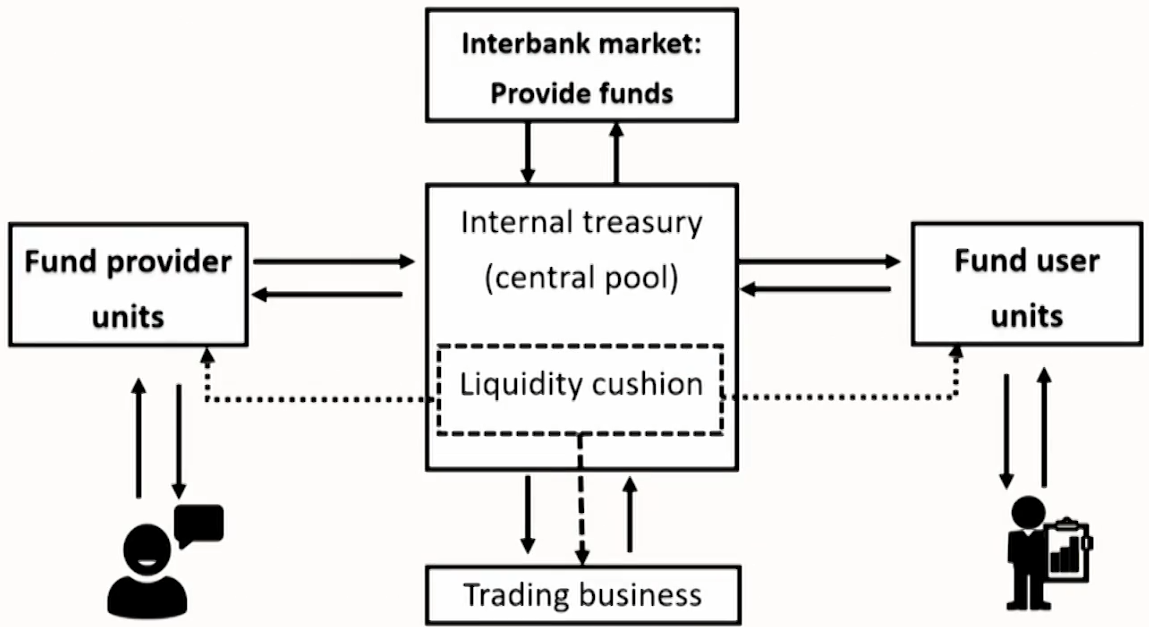
- Purpose of LTP
- Best practice of LTP process
- Governance of the LTP process
- Best practice 1: establish adequate LTP policies and procedures.
- Best practice 2: better to have a centralized funding center. Wholesale funding should be confined to this function.
- Best practice 3: develop trading book policies and identify funding requirements.
- Best practice 4: set up an effective oversight of the LTP process by independent risk and financial control personnel.
- Best practice 5: improve risk-adjusted profit measures to prompt business units to consider the cost of liquidity as part of their decision to book certain assets.
- Best practice 6: related parties involved in the management of LTP should better understand the LTP process.
- Challenges of LTP implementation
- Difficult to maintain proper oversight to manage and monitor the LTP process.
- The Liquidity Management Information Systems (LMIS) are unable to attribute the costs, benefits, and risks of liquidity appropriately to respective businesses at a sufficiently
granular level.
LMIS are widely used by management as a primary source of measuring and monitoring the performance of businesses.
- Approaches of LTP
- "Zero" cost of funds
- "Average" cost of funds
- Matched-maturity marginal cost of funds
"Zero" cost of funds
- Definition: View funding liquidity as free, and funding liquidity risk as zero. (in an easy funding condition)
- Assume interest rate risk is properly accounted for using the swap curve: a zero spread above the swap curve implies a zero charge for the cost of funding liquidity.
- Evaluation: the worst practice
- Results: the hoarding of long-term highly illiquid assets
- Few long-term stable liabilities to meet funding demand.
"Average" cost of funds
- Pooled "average" cost of funds
- Definition: All assets and liabilities irrespective of their maturity are charged the same rate for cost/benefits of liquidity.
Average rate calculated are based on all existing funding sources. - Evaluation: better than zero cost of funds
- Definition: All assets and liabilities irrespective of their maturity are charged the same rate for cost/benefits of liquidity.
- Separate "average" rates for cost and benefits of funds
- Definition: average rates for cost of funds and benefits of fund are calculated separately.
Loans can be encouraged or discouraged by adjusting the average cost of using funds, without affecting the solicitation of funds by fund providers. - Evaluation: better than pooled "average cost of funds
- Definition: average rates for cost of funds and benefits of fund are calculated separately.
- Results:
- Neglects the varying maturity of assets and liabilities by applying a single charge for the use and benefit of funds
- Lags changes in banks' actual market cost of funding.
- Promotes unhealthy maturity mismatch
- Distorts profit assessment
Matched-maturity marginal cost of funds
- Definition: using term liquidity premium to convert fixed rate borrowing costs to floating-rate borrowing costs through an internal swap transaction.
- Evaluation: current best practice but more complex than average cost
- Results:
- Recognize the costs and benefits of liquidity are related to the maturities of assets and liabilities.
Assign higher rates to products that use ar provide longer-term liquidity. - Recognize the importance of having changes in market conditions incorporated into the rate used to charge and credit users and providers of funds. (actual market cost)
- Recognize the costs and benefits of liquidity are related to the maturities of assets and liabilities.
Contingent liquidity risk pricing
- Contingent commitments may result in contingent liquidity risk.
- Lines of credit, collateral postings for derivatives and other financial contracts, etc.
- Liquidity cushion流动性缓存垫: Banks carry a liquidity cushion, a buffer of highly liquid assets or stand-by liquidity to survive periods of unexpected funding outflows.
- Use the results of stress-testing to determine the size of the liquidity cushion.
- Process of Contingent liquidity risk pricing
- Step 1: Identify contingent commitments that are likely to create unexpected funding demands.
- Step 2: Perform stress tests under various scenarios to approximate the funding that might be required.
- Step 3: Net approximations from above against inflows generated.
For example: through the sale of marketable securities to derive the size of the liquidity cushion. - Step 4: Calculate the cost of carry: the cost of funding liquid assets minus the return they generate.
- Step 5: Recoup cost of carry: charging a liquidity premium,at the most granular level, to the business unit, product or transaction that creates the need for the bank to carry such liquid assets.
US Dollar Shortage and Covered Interest Parity Lost
Covered Interest Parity
- CIP is a no-arbitrage condition according to which interest rates on two otherwise identical assets in two different currencies should be equal once the foreign currency risk is hedged:
\frac{F}{S}=\frac{1+r}{1+r^*}- S: spot exchange rate in units of US dollar per foreign currency
- \mathrm{F} : corresponding forward exchange rate
- r: the US dollar interest rate
- r^*: the foreign currency interest rate.
- In practice, the relationship between F and S is read market transactions in FX instruments, notably FX swaps and cross-currency swaps.
- Mechanics of FX swaps
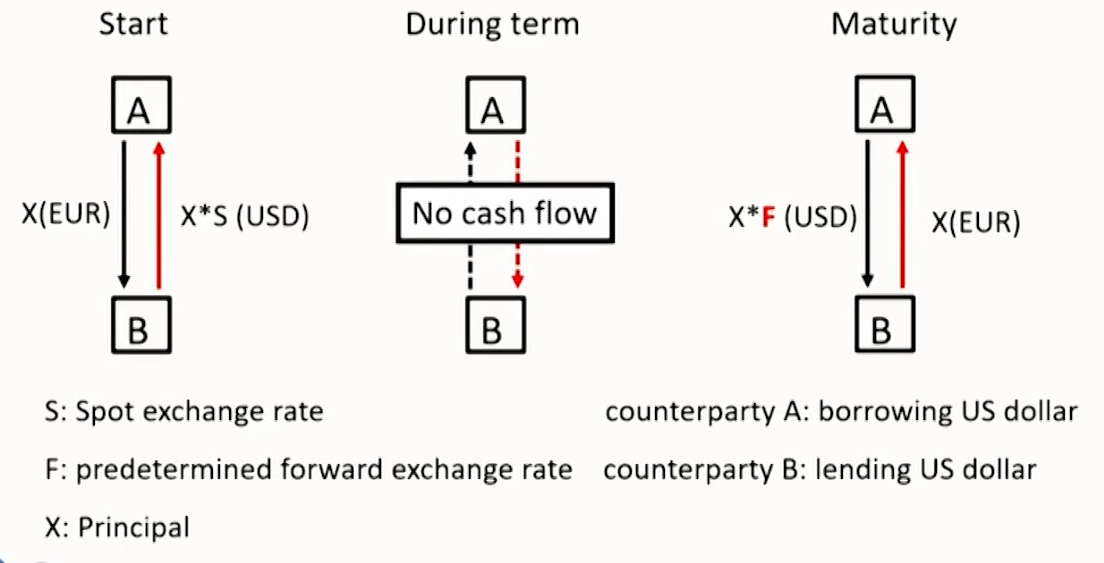
If b ≠ 0, the CIP fails: CIP fails to hold if the party lending a currency via FX swaps makes a higher or lower return than implied by the interest rate differential in the two currencies.
\frac{F}{S}=\frac{1+r^{U S D}+b}{1+r^{\text {foreign }}} - Mechanics of cross-currency swaps
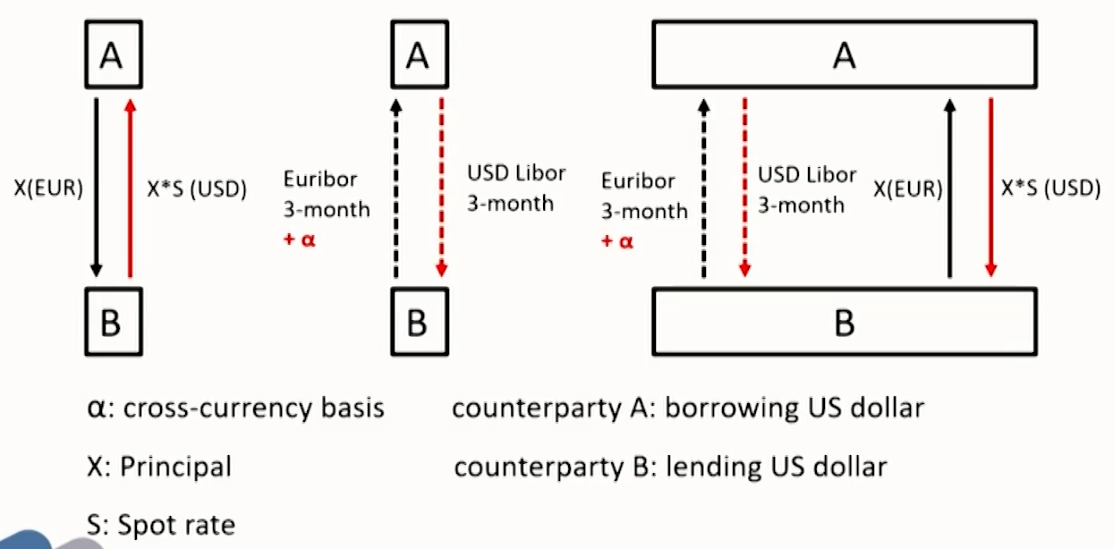
When a ≠ 0, the CIP fails: the failure of CIP if the party lending Us dollars in a cross-currency swap pay the basis,non-zero a, on top of foreign currency. In a cross-currency basis swap, interest payments is base on the reference rates the respective Libor rates plus the basis a.
- Mechanics of FX swaps
The violation of CIP
- Negative basis points period: Since 2007, the basis for lending US dollars against most currencies, notably the euro and yen, has been negative.
- Borrowing dollars through the swap market became more expensive than direct funding in the dollar cash market.
- Reflection of CIP violation: strains in global interbank markets.
- Counterparty risk
- Constrained bank access to wholesale dollar funding inhibited arbitrage
- Causes Of CIP Violation
- Demand for currency hedges
- The reason of why the basis opens up New constraints on arbitrage activity
- The reason why the basis does not close
- Market structural changes tighten limits to arbitrage.
Structural changes in how market participants have been pricing market, credit, counterparty and liquidity risks post- crisis have tightened limits to arbitrage. - Balance sheet space is not free and arbitrage can be both costly and risky.
Arbitrage enlarges its balance sheet, and banks possibly face credit risk, mark-to-market and liquidity risk. - Changes in regulation have reinforced market pressures for a tighter management of balance sheet risks.
Derivatives transaction changes: changes related to credit value adjustments have sought to incentivize dealers to price the counterparty risk more accurately
Basel III and US leverage ratios changes: potential future exposure adjustment charges require market participants to hold capital in proportion to their derivatives and other exposures.
Liquidity Risk Management Tools
Early Warning Indicators
Definition
- Early warning indicators (EWIs) are analogous to warning lights on a car dashboard.
- EWIs are changes in key metrics (qualitative or quantitative) that could signal a pending liquidity problem and they can vary in severity and priority.
EWI & Liquidity risk management process(LRM)
- LRM framework begins by identifying liquidity and funding risks that are inherent in the business activities.
- LRM framework should be end-to-end and ensure that the bank will "sufficiently capture the banking organization's exposures, activities, and risks."
- Ensure that EWIs are updated and aligned with other core aspects of the LRM framework.
- Ensure the quality and timeliness of the data that feeds into the EWIs.
FrameworkComponents: M.E.R.l.T
- Measures
- Measures should be leading先行的 and sharp敏锐.
Leading(forward looking): provide information and signal potential stress prior to the occurrence of an actual event.
Sharp(sufficiently granular): signals do not go unnoticed within the mass of data. - Measures should contain both external and internal measures.
Internal measures: customize bank's B/S and activities.
External measures: signal systemic changes in the economy or market.
- Measures should be leading先行的 and sharp敏锐.
- Escalation
- An effective escalation policy should ensure that limit breaches are escalated to the appropriate level of management with the authority to undertake corrective actions.
- Modest response: increase liquid asset buffer
- Large cash outflow from EWI: asset-liability committee(ALCO)
- Extreme cases: contingency funding plan(CFP)
- Reporting
- EWI report needs to be timely in order to provide management with sufficient lead time to make adjustment in response to potential crisis events. It is common practice to have the EWI dashboard reported on a daily basis.
- Integrated systems
- Metrics and reporting are feasible and meaningful only when they are backed by the bank's ability to calculate the selected metrics and report them consistently.
- Thresholds
- Firms use a stoplight system in represent and communicate performance against the thresholds of their EWIs.
Green indicator: the measure is within normal bounds.
Amber indicator: the measure should be investigated further.
Red indicator: significant concern and may need an immediate response. - The threshold boundaries for which an EWI moves from green to amber should not be too wide or too narrow.
Use back-testing to determine if recalibration is needed.
- Firms use a stoplight system in represent and communicate performance against the thresholds of their EWIs.
Guidelines from OCC
- EWI may include but not limited to the items listed below:
- A reluctance of traditional fund providers to continue funding at historic levels.
- Pending regulatory action(both formal and informal) or CAMELS component or composite rating downgrade(s).
CAMELS: capital, asset quality, management, earnings,liquidity, and sensitivity. - Widening of spreads on debts, credit default swaps, and stock price declines.
- Difficulty in accessing long-term debt markets.
- Reluctance of trust managers, money managers, public entities, and credit-sensitive funds providers to place funds.
- Rising funding costs in an otherwise-stable market.
- Counterparty resistance to off-balance-sheet products or increased margin requirements.
- The elimination of committed credit lines by counterparties.
Guidelines from BCBS
- EWI may include but not limited to the items listed below:
- Rapid asset growth, especially when funded with potentially volatile liabilities.
- Growing concentrations in assets or liabilities.
- Increases in currency mismatches.
- Decrease of weighted average maturity of liabilities.
- Repeated incidents of positions approaching or breaching internal or regulatory limits.
- Negative trends or heightened risk associated with a particular product line.
- Negative publicity
- Credit rating downgrade
- Stock price declines
- Rising debt costs
- Widening debt/credit-default-swap spreads
- Rising wholesale/retail funding costs
- Counterparties requesting additional collateral or resisting entering into new transactions
- Drop in credit lines
- Increasing retail deposit outflows
- Increasing redemptions of CDs before maturity
- Difficulty accessing longer-term funding
- Difficulty placing short-term liabilities
- Intraday liquiditymonitoring indicators include:
- Daily maximum liquidity requirement
- Available intraday liquidity
- Total payments
- Time-specific and other critical obligations
- Value of customer payments made on behalf of financial institutions customers
- Intraday credit lines extended to financial institution customers
- Timing of intraday payments
- Intraday throughput
Guidelines from Federal Reserve
- EWI may include but not limited to the items listed below:
- Negative publicity concerning an asset class owned by the institution.
- Increased potential for deterioration in the institution's financial condition.
- Widening debt or credit default swap spreads.
- Increased concerns over the funding of off-balance-sheet items.
Intraday Liquidity Risk Management
Basics of intraday liquidity
- A bank treasurer manages intraday liquidity risk and enumerates the sources and uses of intraday funds for a typical large bank.
- Target: Ensure the bank remains within the limits of its daylight credit resources and ends the day with the appropriate target balances in its accounts.
- Challenges: factors of intraday funds management target
Variability of cash flow patterns
Impact of market forces
Lack of real-time data
- Uses of intraday liquidity fund
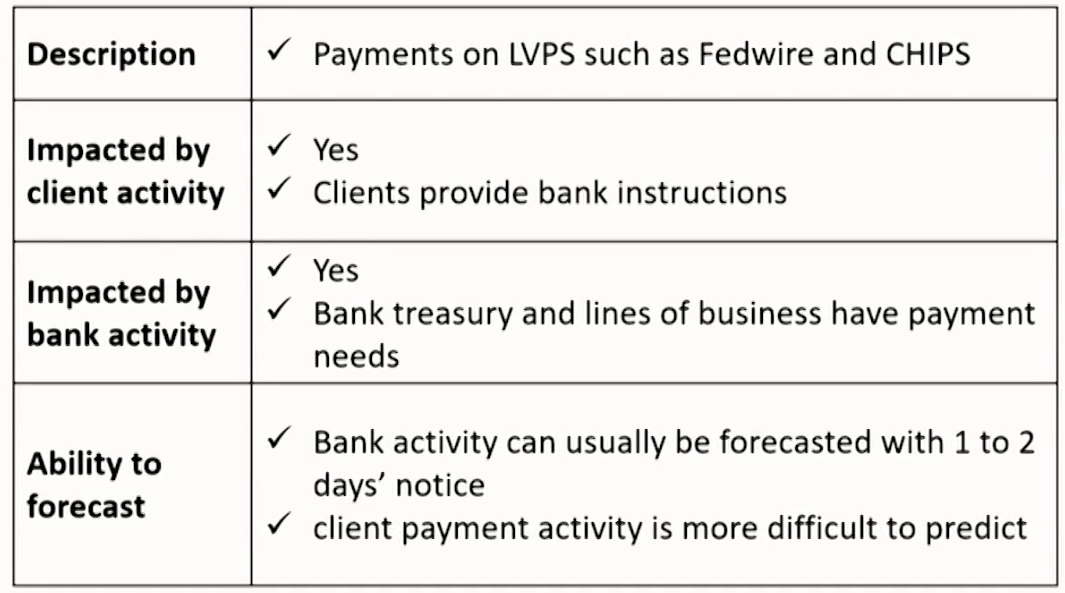
- Outgoing Wire Transfers (largest use of intraday liquidity)
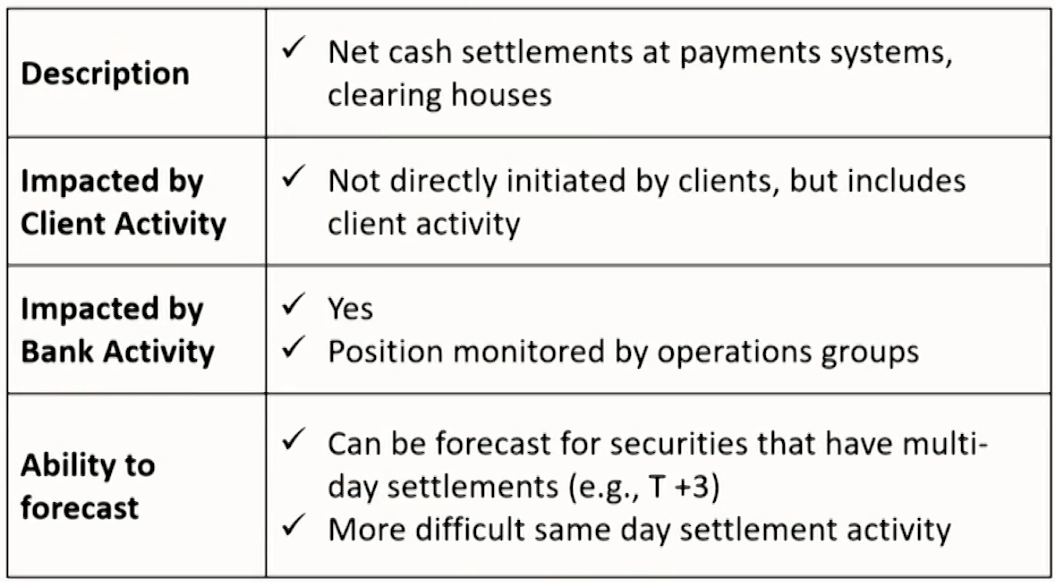
- Settlements at PCS systems
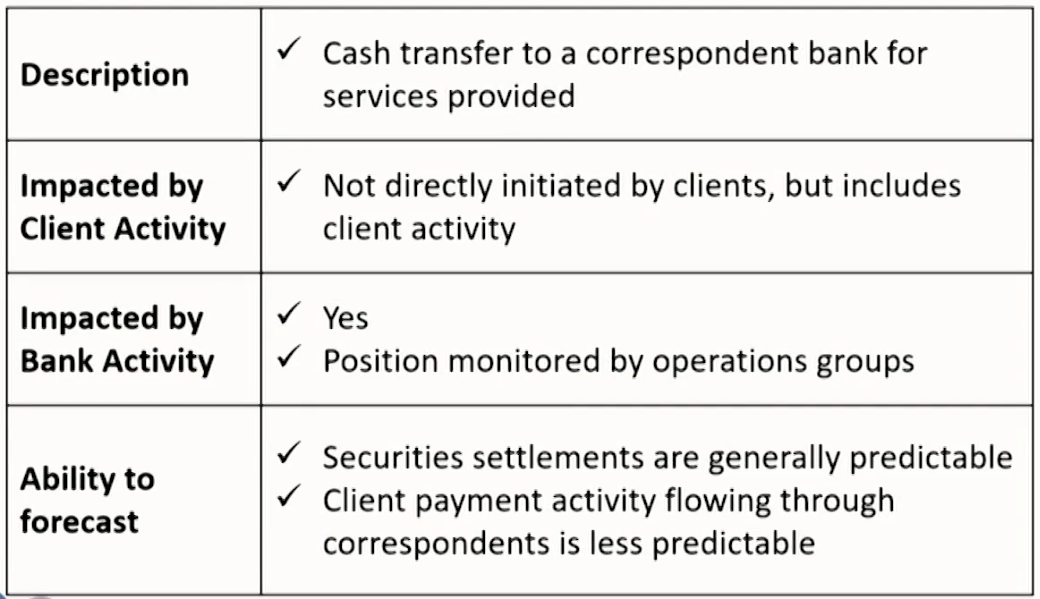
- Funding Nostro Accounts
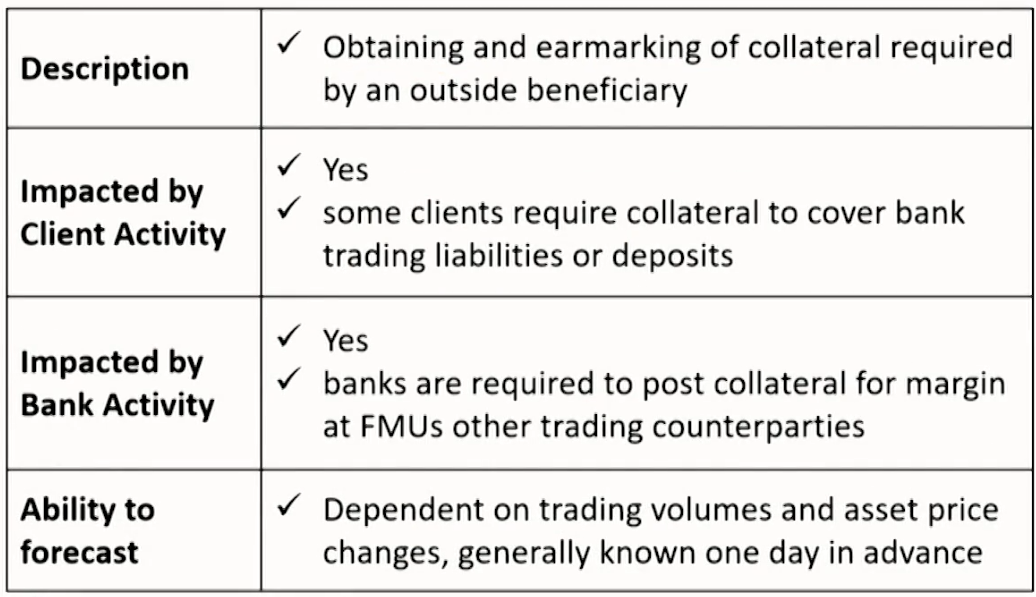
- Collateral Pledging
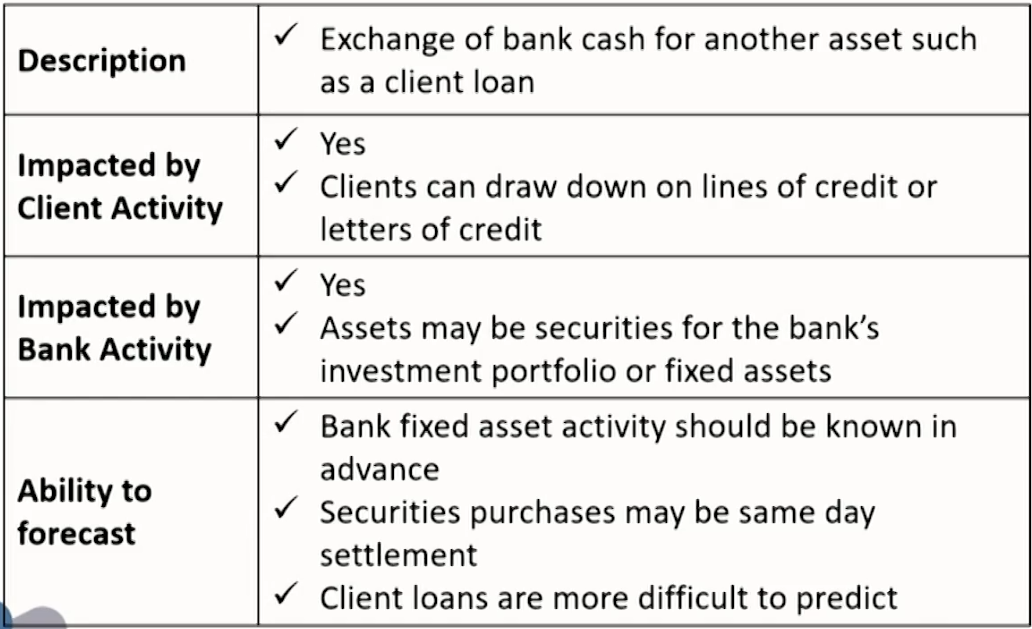
- Asset Purchases/Funding
- Outgoing Wire Transfers (largest use of intraday liquidity)
- Sources of intraday liquidity fund
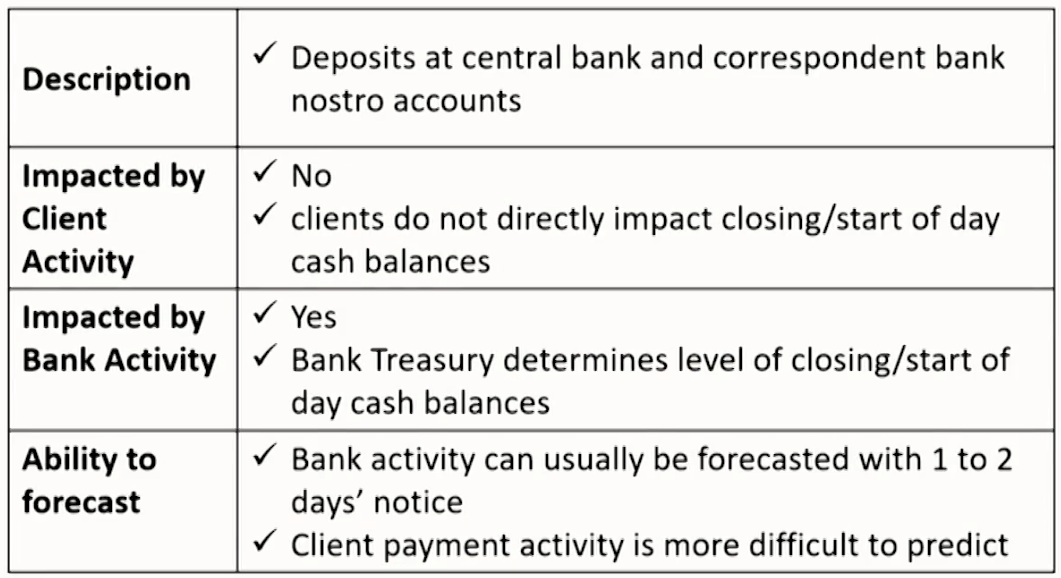
- Cash Balances
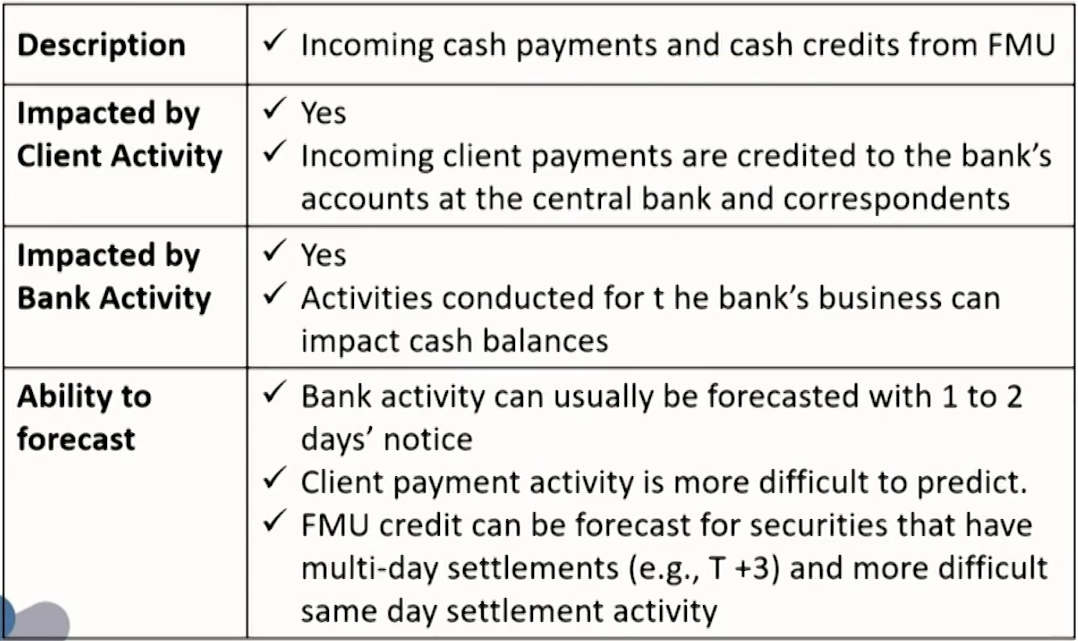
- Incoming Funds Flow
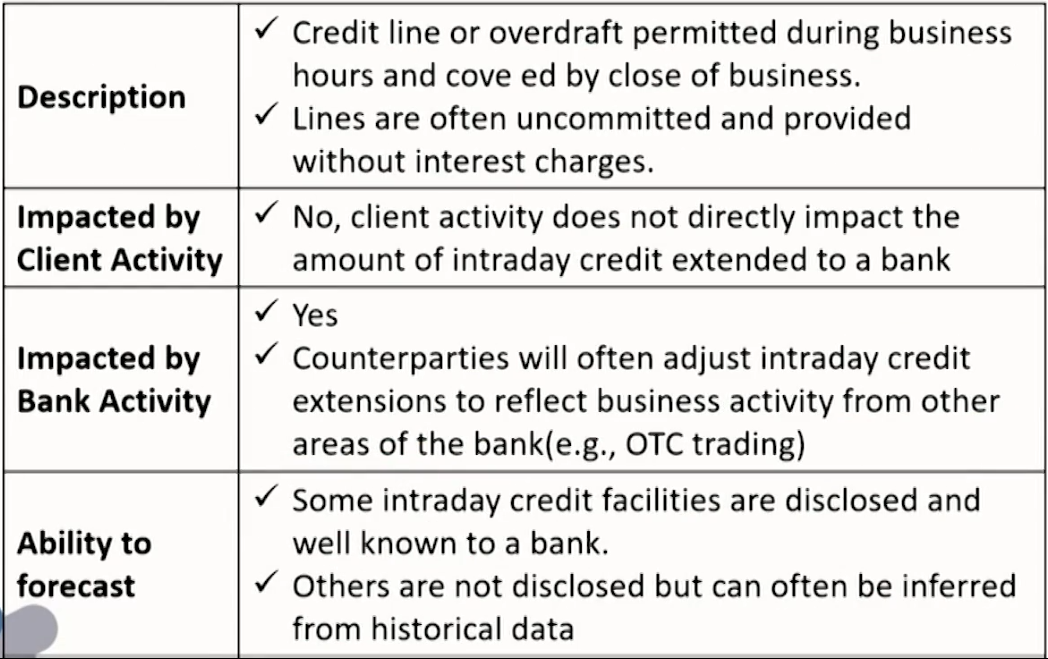
- Intraday credit
- Liquid Assets
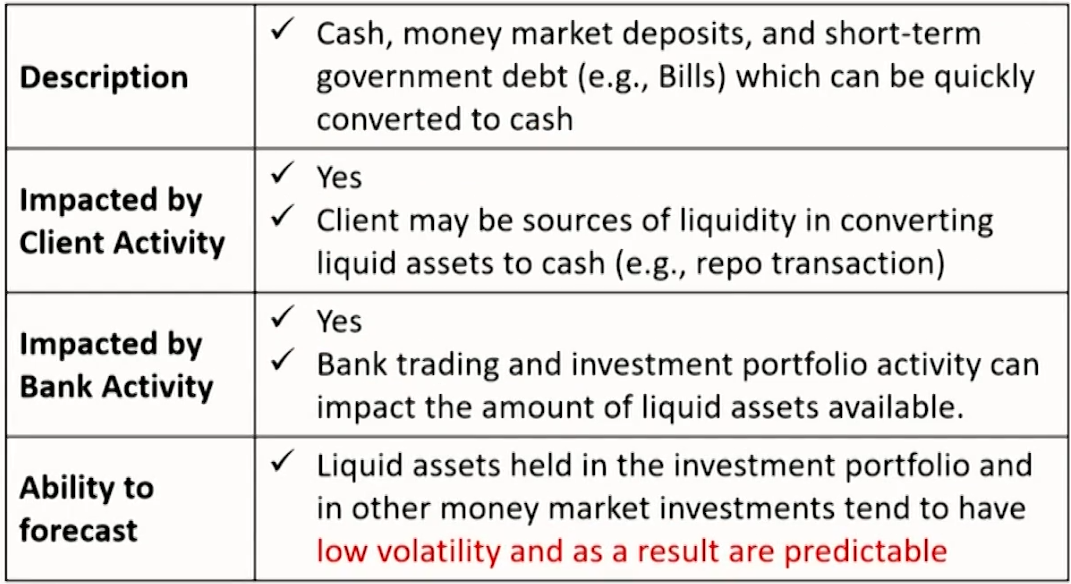
- Overnight Borrowings
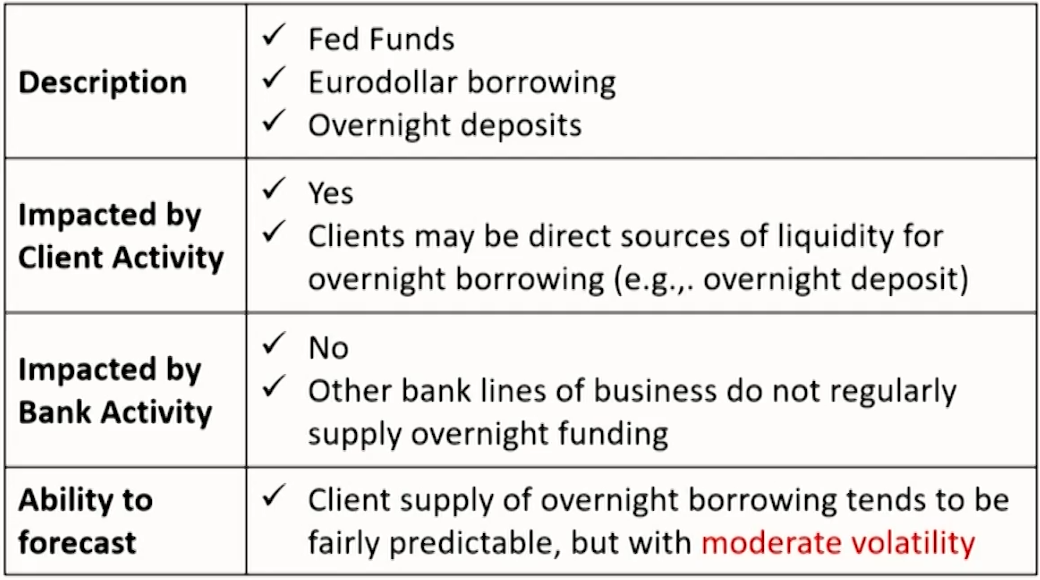
- Other Term Funding
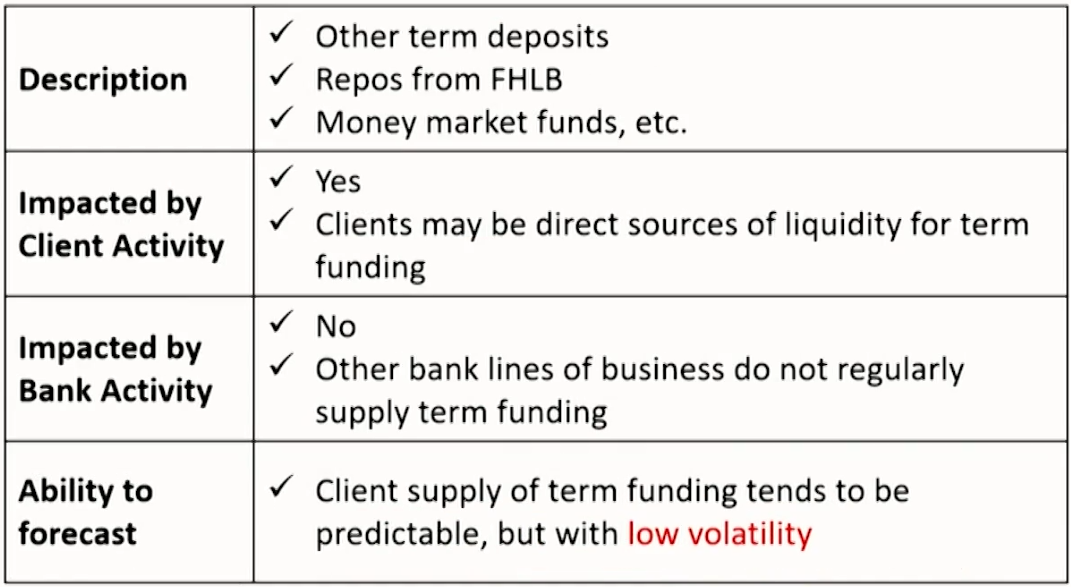
- Cash Balances
Governance of Intraday LRM
- Active risk management
- Classify settlement and systemic risks as components of risk taxonomy, and critically, incorporate these risks into the firm's risk appetite framework.
- Integration with risk governance: Oversight of intraday liquidity risk management is integrated into the bank's overall risk oversight structure.Three lines of defense model:
- Treasury: manages the intraday funding positions of risk management programs related to funding activities.
- Corporate Risk Management: oversees funding-related policy and procedures.
- Internal Audit: independently assesses the bank's adherence to intraday risk policies and procedures.
- Risk assessment
- Through risk self-assessments, settlement risks related to existing and potential new products and operational processes are identified, measured, and evaluated.
- Risk measurement and monitoring
- The amount of intraday credit the institution is extending to clients.
- The amount of intraday credit the institution utilizes.
Measures for understanding intraday flows
- Total payments
- A bank and its intraday risk management should maintain statistic concerning the amount of payments it makes on all electronic payments systems in which it participants.
- For example:
Total payments sent and received for non-financial institution or financial institution clients / bank activity.
Net position in the settlement account at any time of day in aggregate
- Other cash transactions
- A bank should also track its intraday and end-of-day settlement positions at all financial market utilities in which it participates, such as collateral position in SSN
- Settlement positions
- If complete data to reconstruct account positions at any time of day is not available, at a minimum a bank should maintain data on its settlement positions with all its FMUs.
- Time sensitive obligations
- For those transactions require completion at a specific time during the day, such as return of borrowing, margin payments. Failure to settle may result in a financial penalty.
- Total intraday credit lines to clients and counterparties
- Bank should have data regarding average and peak usage,and the ability to model activity at the client and portfolio levels.
- Total bank intraday credit lines available and usage
- The amount of intraday credit that a bank relies on in business-as-usual conditions and the maximum amount of intraday borrowing it can draw down.
- Captures the amount of committed and uncommitted intraday credit (and usage thereof) the bank has at its disposal, ideally across all its cash and settlement accounts.
Measures for quantifying and monitoring risk levels
- Daily maximum intraday liquidity usage
- Formula: the day's largest negative balance / the size of the committed or uncommitted credit line
This calculation does not need real-time monitoring of an account to capture all of the negative positions - Typically, the peak and average of this metric is tracked over a period of time(e.g. monthly).
- Formula: the day's largest negative balance / the size of the committed or uncommitted credit line
- Intraday credit relative to tier 1 capital
- Formula: Intraday credit / Tier 1 capital
The measure should be tracked for total intraday credit and unsecured intraday credit, available and used.
Represents the intraday settlement risk. - Available unsecured intraday credit relative to an institution's tier 1 capital is a rough measure of the inadvertent systemic risk that the institution poses to the financial system.
- Formula: Intraday credit / Tier 1 capital
- Client intraday credit usage
- Formula: Client's peak daily intraday overdraft / established (committed or uncommitted) credit line
- Provides useful insights for understanding how client activity impacts the bank's ability to manage its own intraday liquidity
- Payment throughput
- These measures track the percentage of outgoing payment activity relative to time of day.
- Help the bank identify and monitor its peak periods over time and the correlation of this activity with its intraday liquidity on hand and intraday credit usage.
Liquidity Risk Reporting
Liquidity Risk Reporting
- A bank will produce a number of liquidity reports in the normal course of business, on a daily, weekly, monthly and quarterly basis.
- The main liquidity reports and its frequency are required by the regulator.
- ALCO view regulator's requirements as a minimum requirement, and supplement it with additional management information as desired.
- Reports are an important part of liquidity management information (MI).
- Summary and Qualitative report
- Summary report: Liquidity report MI for senior management should be presented as a 1-page summary of the key liquidity metrics.
Increase the chance that the report will be read and noted at senior management level
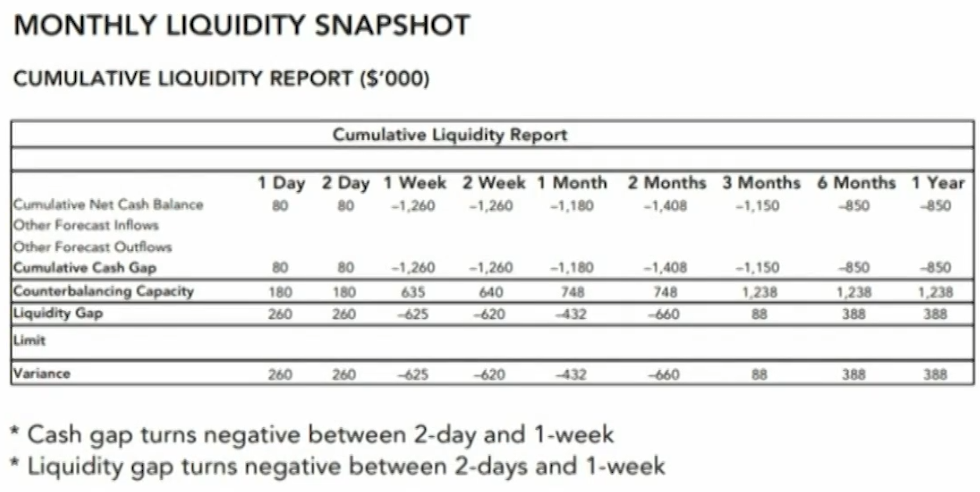
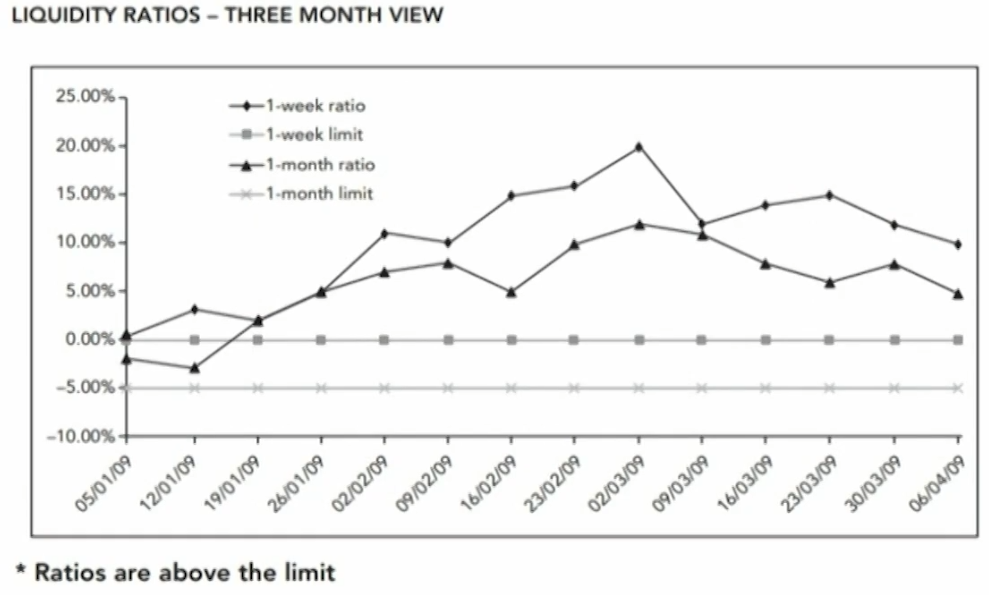
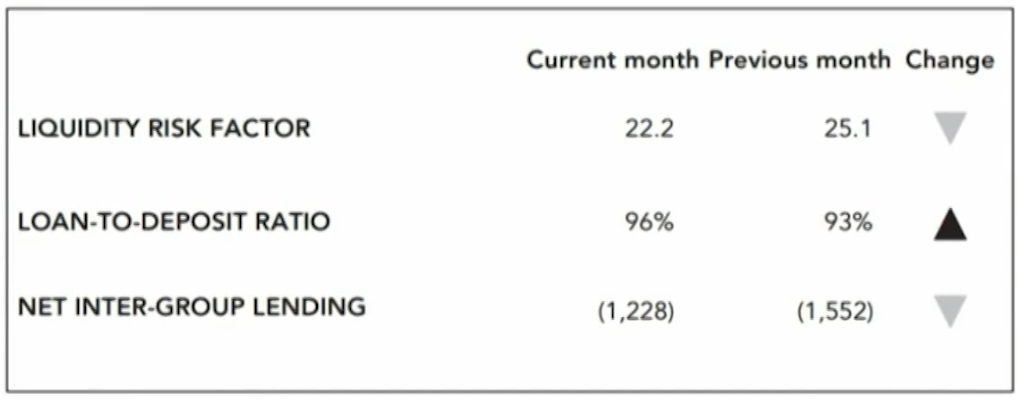
- Qualitative report: should be completed for Head Office Group Treasury on a monthly basis, for banking groups that operate across country jurisdictions and multiple subsidiaries.
Assist the group to better understand the liquidity position in each country.
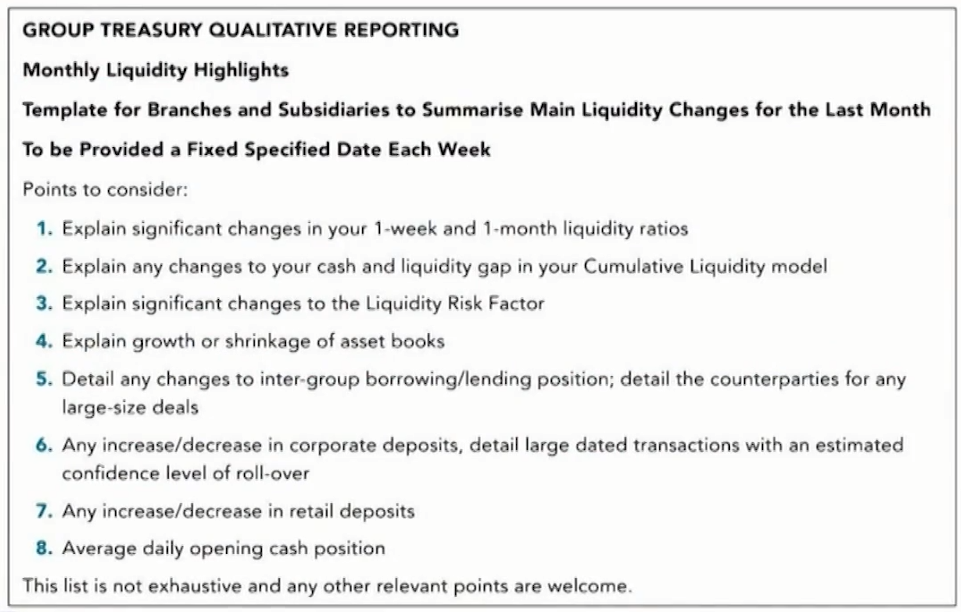
- Summary report: Liquidity report MI for senior management should be presented as a 1-page summary of the key liquidity metrics.
Benchmark liquidity reports for regulated banks in the UK
- Deposit tracker report
- Definition: A simple report of the current size of deposits by customer type and forecast of what the level of deposits are expected to be going forward. LTD ratio is also provided.
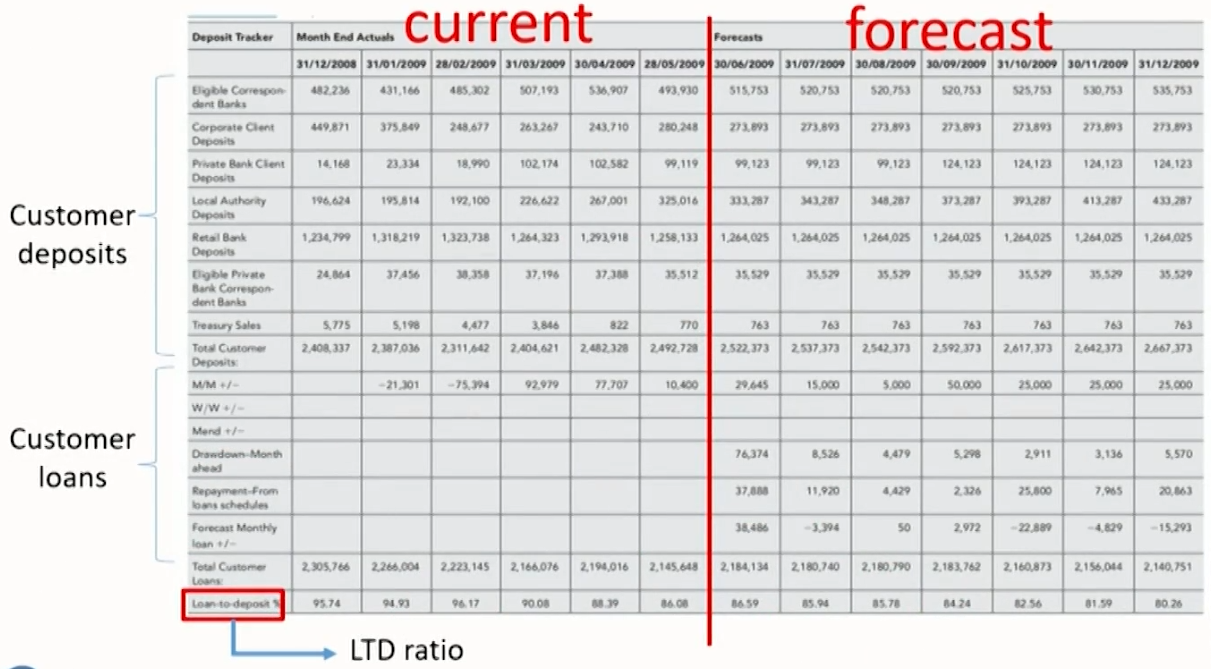
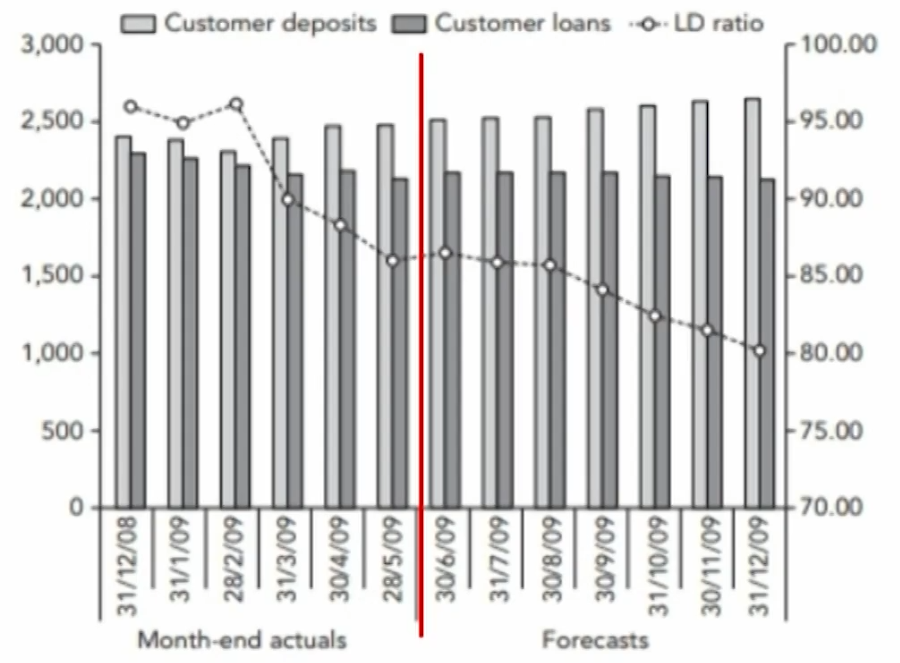
- Identified liquidity position: Loan to deposit ratio (LTD)
Too high: may not have enough liquidity to cover any unforeseen fund requirements.
Too low: may not be earning as much as it could be. - Frequency: weekly and monthly
- Definition: A simple report of the current size of deposits by customer type and forecast of what the level of deposits are expected to be going forward. LTD ratio is also provided.
- Daily liquidity report
- Definition: A straightforward spreadsheet detailing the bank's liquid and marketable assets and liabilities, up to 1-year maturity. Each branch and subsidiary will complete this report.
- Input data: Summarizes the bank's liquid assets, liabilities by maturity/tenor.
- Output metrics: Provides an end-of-day of the bank's liquidity position like liquidity gap, cumulative cash gap.
- Frequency: daily
- Funding maturity gap (mismatch) report
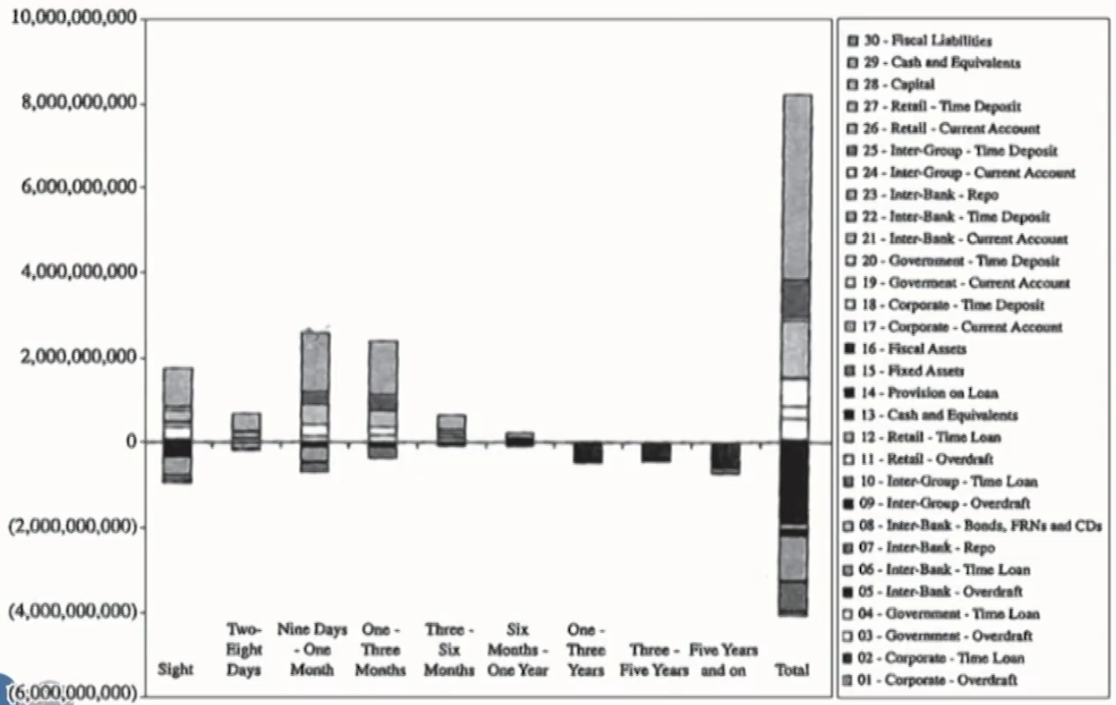
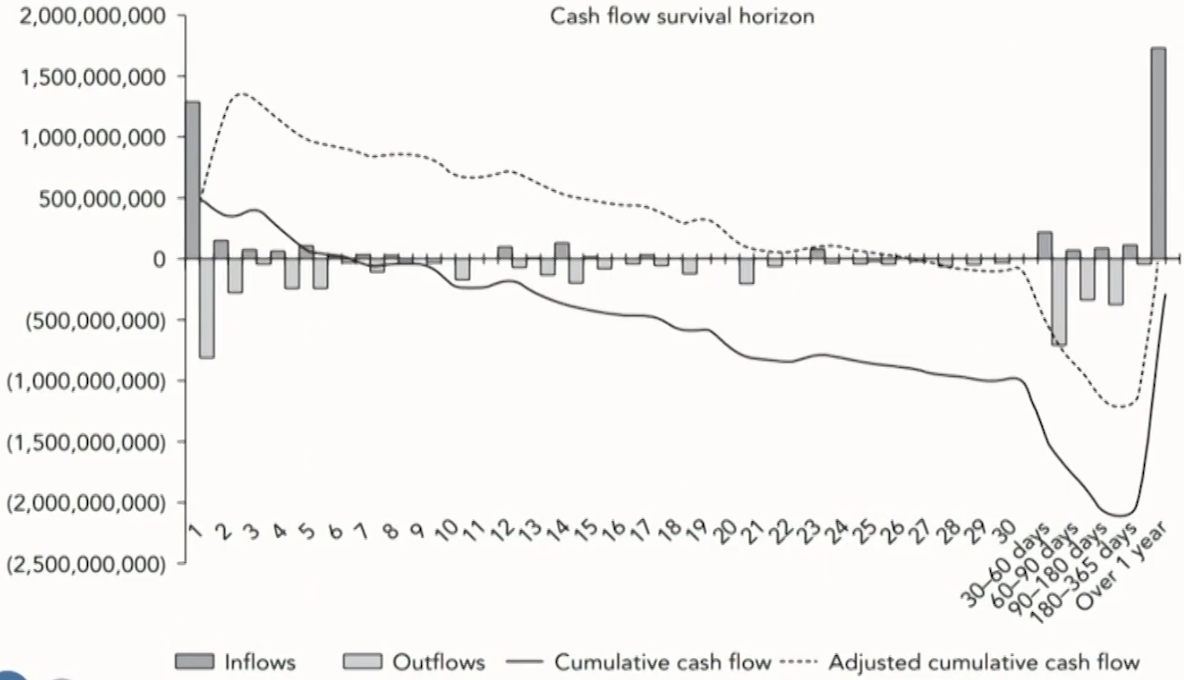
- Definition: shows the maturity gap (maturity mismatch) per time bucket, for all assets and liabilities, with an adjustment for liquid securities.
Identified liquidity position: cumulative liquidity cash flow of daily liquidity report is included in this report.
30-days survival horizon: required by Basel III. - Frequency: monthly
- Definition: shows the maturity gap (maturity mismatch) per time bucket, for all assets and liabilities, with an adjustment for liquid securities.
- Funding concentration report
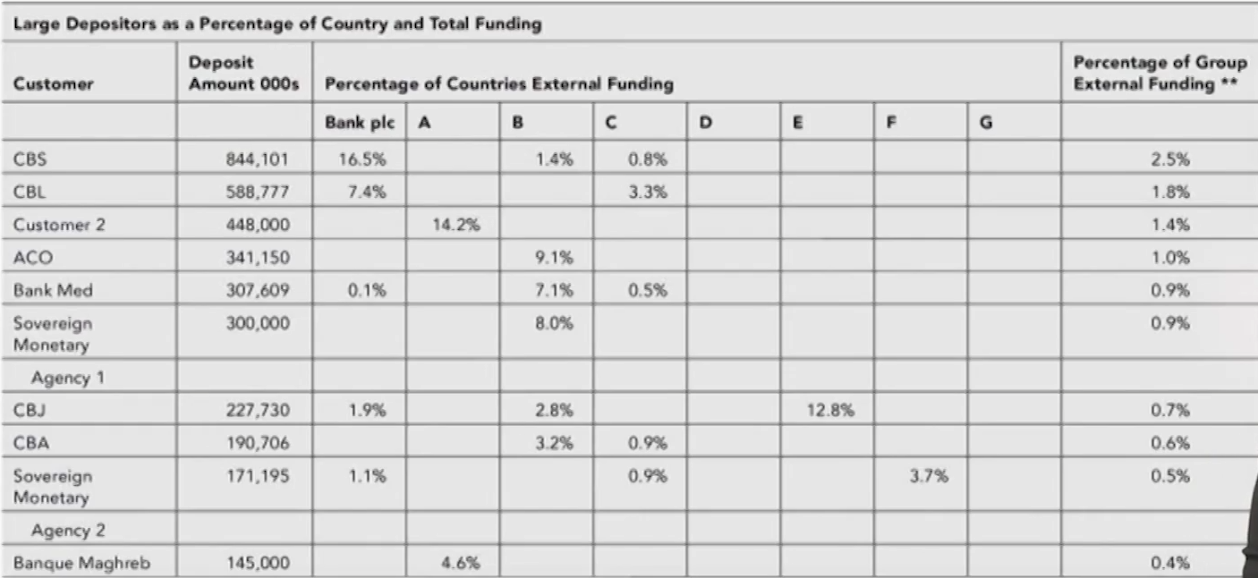
- Definition: Funding source concentration reports
Funding diversity: A bank should not become over-reliant on a single source, or sector, of funds. A deposit of 5% of total liabilities should be treated as large by ALCO. - The way to increase diversity: Increase its liabilities rather than asking the depositor to remove some of the fund to avoid damaging the relationship.
- Frequency: monthly
- Definition: Funding source concentration reports
- Undrawn commitment report
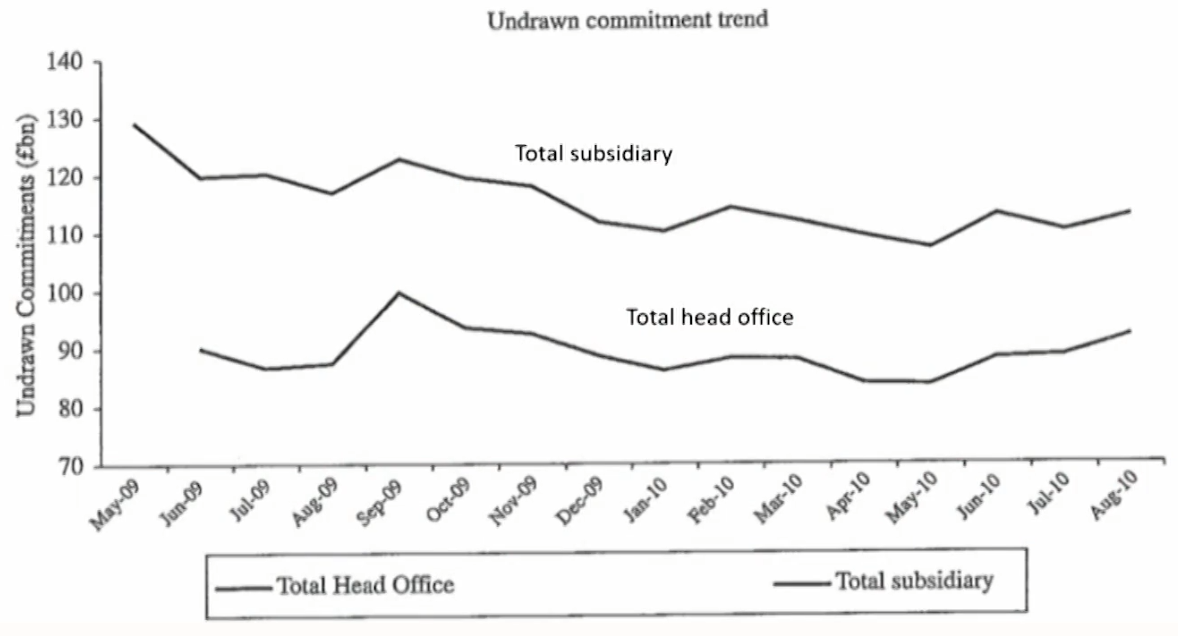
- Definition: shows the existence of undrawn commitment trend over time.
- Off balance sheet products: potential stress points for a bank's funding requirement and exacerbate funding shortages at the wrong time.(Liquidity lines, revolving credit facilities, letters of credit,guarantees)
- Frequency: monthly
- Liability profile
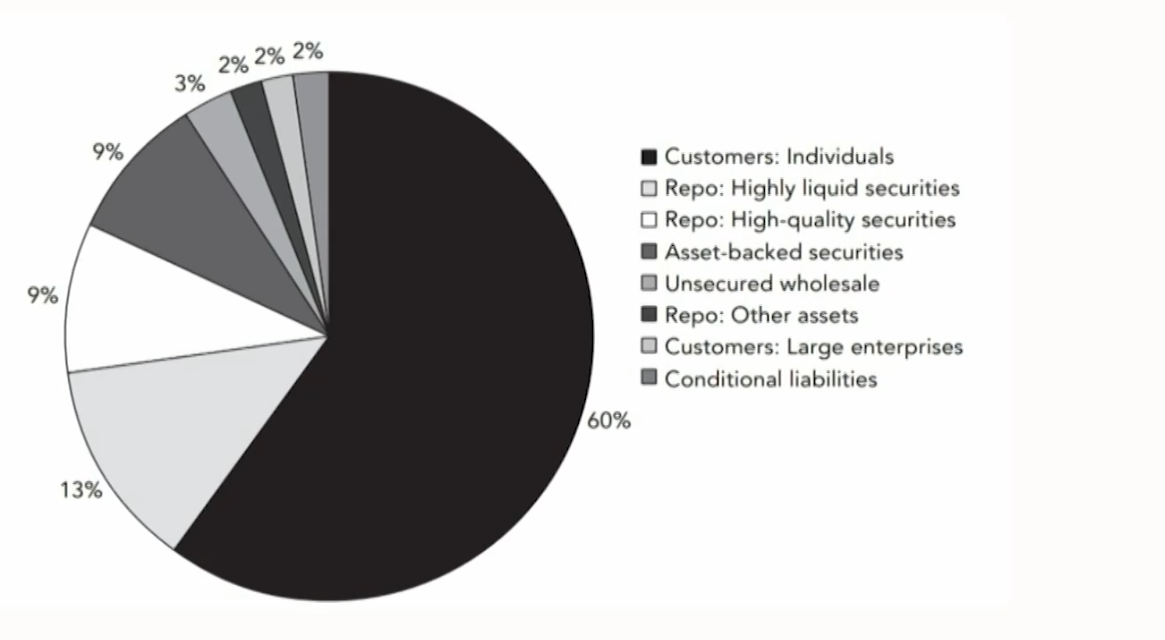
- Definition: A simple breakdown of the share of each type of liability at the bank. The report format can be set to the user's desired choice.
- The total liabilities are made of the following categories:
Customers: individual and large enterprises
Repo
Asset-backed securities
Unsecured wholesale, etc. - Frequency: monthly
- Wholesale pricing and volume
- Definition: a report of firm-specific yield curve.
- Liquidity strength can be gleaned from looking at a bank's funding costs, and the composition of its funding by
product. - An early warning of a particular bank experiencing funding stress if its funding yield curve is rising materially above that of its peer group.
- Frequency: at least quarterly
Liquidity Stress Testing And Reporting
Four categories of funding liquidity
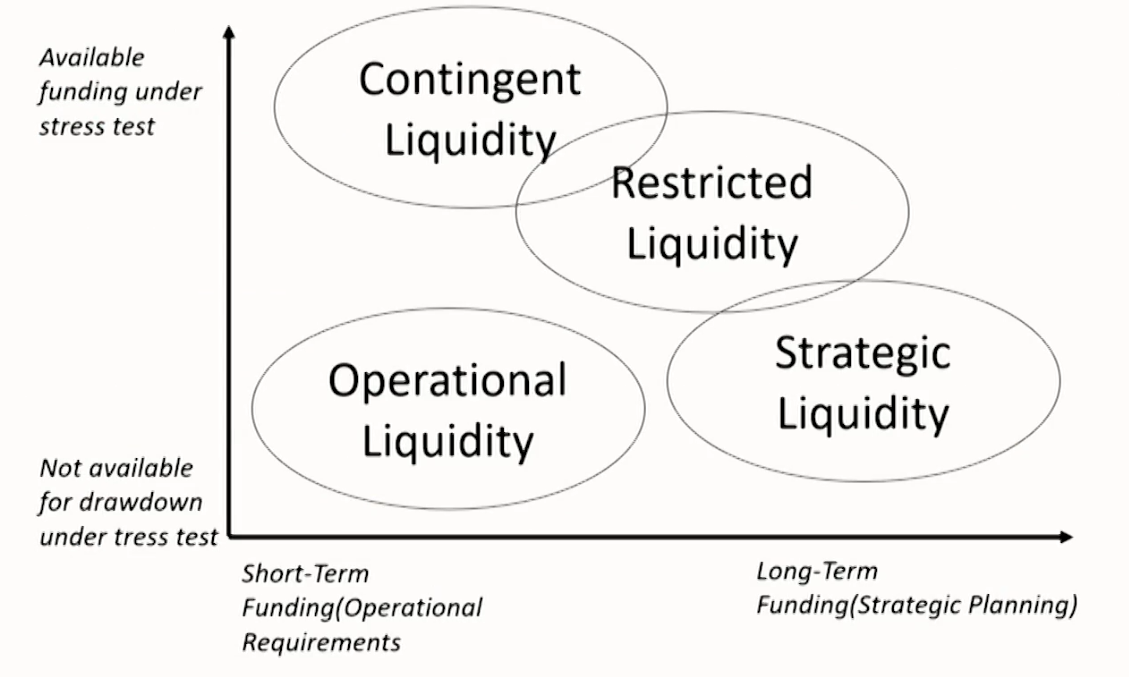
- Operational liquidity: The cash that is needed to fund the business daily.
- May be quite volatile
- May need cushion for unpredictability of daily settlement
- Restricted liquidity: Liquid assets only for specifically defined purpose, such as collateralization.
- Unavailable to meet general financial obligations under a liquidity stress test.
- Strategic liquidity: The cash that is held by the institution to meet future business needs, outside the course of normal operations.
- Fixed asset purchases or M&A
- Contingent liquidity: Liquid asset buffer composed of high quality and liquid financial assets.
- Meet general financial obligations under a stress scenario.
Estimating stressed liquidity asset buffer
- Stressed liquidity asset buffer: indicates the adequacy of the current liquid asset buffer given stress scenario assumptions.
- Calculation formular:
- stressed liquidity asset buffer = normal liquidity asset buffer - stressed cash outflow + stressed cash inflow
- Normal liquidity asset buffer: the amount of contingent liquidity currently held.
- Stressed outflow: require early settlement of liabilities or the inability to rollover debt.
- Stressed inflows: such as drawdowns on liquidity facilities available to the institution.
Design of the model
- Organizational scope
- Liquidity transfer restrictions: Liquidity may be trapped in certain legal entities and cannot be transferred freely throughout the organization
- Currency: Perform liquidity stress test in the currency of the entity being tested, and take liquidity impact of currency conversion requirements for consideration
- Regulatory jurisdiction: Perform separate stress tests for the foreign entities
- Scenario development
- Historical scenarios历史模拟法
Historical scenarios are based on actual liquidity failures and attempt to translate those events to the financial institution performing the stress test.
Disadvantage: The existence of few examples with limited data; The past is not always indicative of the future - Hypothetical Scenarios假设情景法
Forward-looking view in which the financial institution experiences severe liquidity stress:
Distinguish between systemic and idiosyncratic risk
Distinguish between levels of severity.
Clearly define the scenarios.
Reverse liquidity stress tests: supplement to hypothetical scenarios.
- Historical scenarios历史模拟法
- Development of assumptions
- Qualitatively assess the expected liquidity behavior for each type of cash flow to determine where there is significant liquidity risk.
- Determine the appropriate level of segmentation for each type of risk based on an assessment of behavioral differences, bearing in mind any limitations in ongoing data availability.
- Develop matrices of relative modeling assumptions based on scored risk levels and baseline historical data.
- Adjust assumption matrices as appropriate for each stress scenario, for example, reflecting differences in relative overall severity or assumptions concerning idiosyncratic or systemic risk.
- The following assumptions can have an outsized impact on the results of the stress test, and should be considered carefully in developing the model:
Investment portfolio haircuts
Deposit outflows
Unsecured wholesale funding
Collateral requirements
Other contingent liabilities
Business dial back
- Outputs of the model
- Stress testing assumptions
Overall stress level by the scenarios
Indication of whether the scenario is systemic,idiosyncratic, or both
Contribution of economic, market, and firm-specific events
Cash flows resulting from the scenario - Liquidity position metrics: Main objective is to determine how much liquidity is available compared to the net cash outflows.
- Prospective liquidity position metrics: Highlight any times during the stress horizon where survival would require significant transactions such as capital infusion and debt issuances.
- Capital and performance metrics: Captures the impact of any capital actions required to support liquidity during the stress period.
- Stress testing assumptions
- Governance and controls
- Asset-liability committee(ALCO)
The ALCO is in charge of the liquidity stress testing framework.
Ensuring the establishment, review, and approval of a liquidity stress testing policy.
Suggesting and approving liquidity risk scenarios.
Setting liquidity risk policy limits dependent on stress test outcomes. - Treasury unit ( the first line of defense)执行
Maintenance of liquidity stress testing procedures.
Recommending stress test scenarios.
Analyzing liquidity characteristics of the assets and liabilities.
Recommend assumptions used in stress testing to ALCO.
Reports results of stress testing. - Risk management department ( the second line of defense)
Administering the liquidity risk stress testing policy
Reviewing and providing effective challenge of the scenario design and assumptions
Ensuring the institution's approach to liquidity stress testing is in line with acceptable industry practices and regulatory rules and guidance
Reviewing and approving the liquidity stress test-based limits
Monitoring af liquidity stress test-based limits
Ensuring the institution's ALCO, executive management,and board are kept well-informed of the bank's liquidity risk profile as indicated by the stress testing results - Internal audit( the third line of defense)
Regular checks on the stress testing process, procedures,and controls as a confirmation.
- Asset-liability committee(ALCO)
- Integrations with other risk models
- Liquidity stress testing and capital stress testing: Liquidity stress test incorporates any required capital infusions of subsidiary entities. Capital stress testing should consider liquidity stress evaluation.
- Liquidity stress testing and asset liability management: Liquidity stress test scenario framework, and liquidity risk EWls should not neglect to include the possibility of an interest rate shock and the potential impact such an event would have on indeterminate liabilities.
- Liquidity stress testing and funds transfer pricing: Cost of carrying cash buffer required in liquidity stress testing will be priced through FTP framework.
Liquidity Stress test report
- Definition: Stress test output results (report)
- Help senior management to understand the liquidity position of the bank, enabling them to take mitigating action if deemed necessary.
- Cash flow survival report
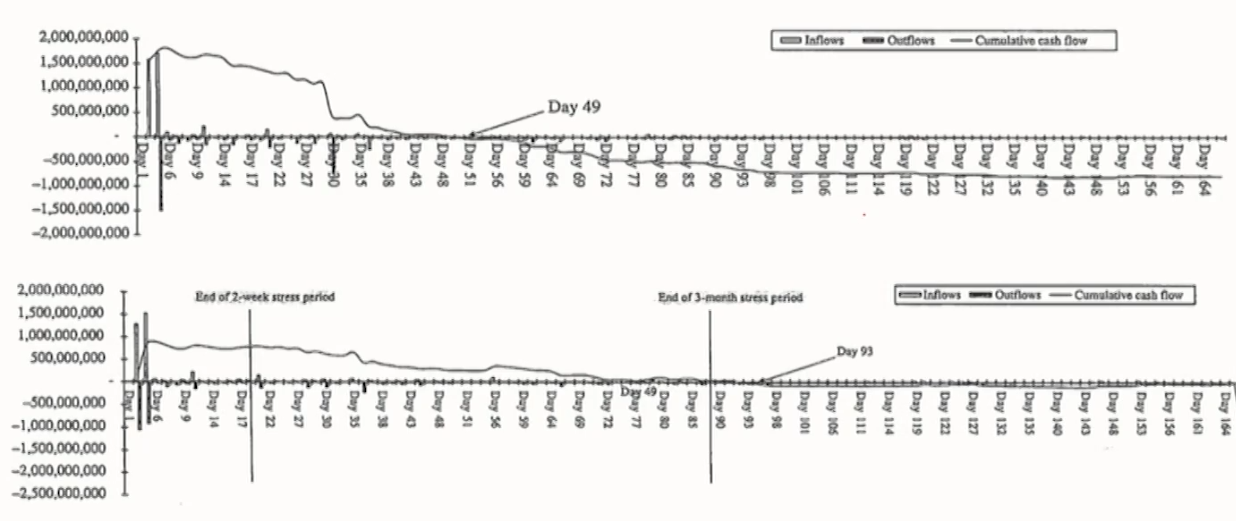
- The primary stress test output
- A report under business as usual (BAU) conditions and one after taking the mitigating actions (such as liquidating securities, and accessing contingency funding sources).
- Frequency: weekly for firm-specific/daily for market-wide.
- Stressed cumulative cash flow forecast
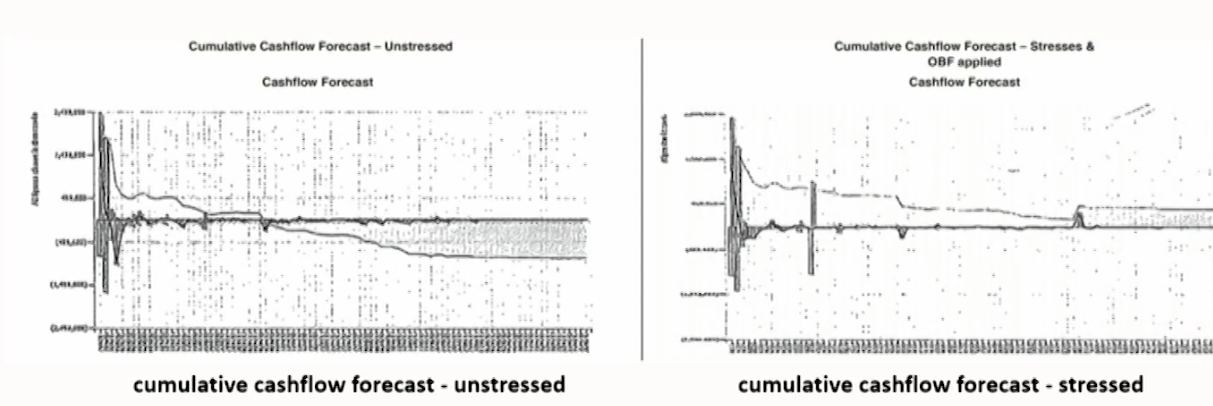
- The second stress test output shows the stressed cumulative cash flow forecast taking into account the immediate sale repo of marketable securities.
- Line-by-line stress test result report
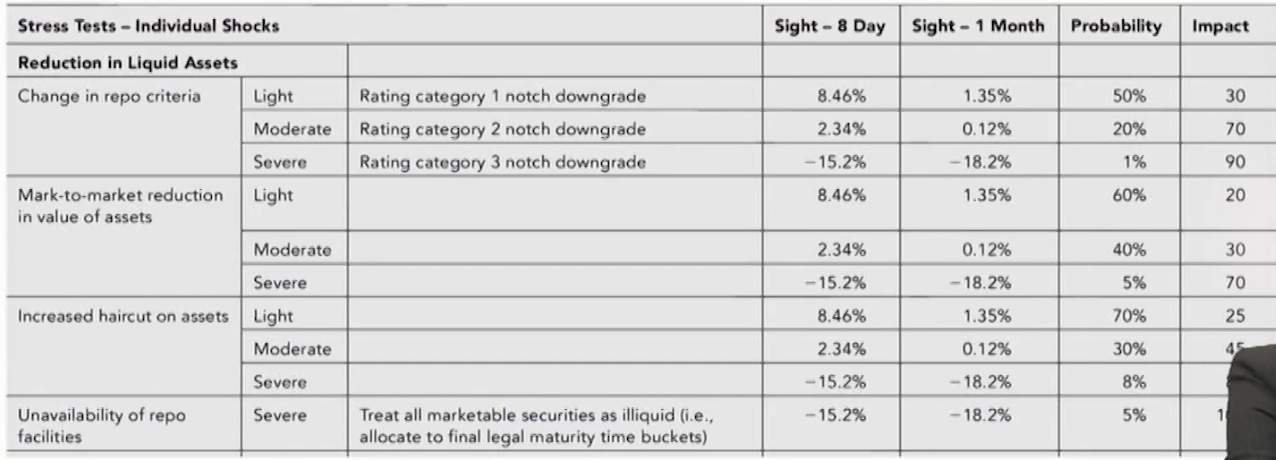
- Show the results of individual shocks on the liquidity ratio,and the probability of each result occurring and is a part of routine stress testing undertaken by Treasury or Risk Management.
- Individual shocks like:
Reduction in liquid assets
Decrease in liabilities
FX mismatch - Frequency: quarterly or required by the regulator.
Contingency Funding Planning
Introduction
- Definition: Contingency Funding Plan(CFP) provides a structured approach for developing and implementing the institution's financial and operational strategies for effectively managing such contingent liquidity events during periods of severe market and financial stress.
- Business as usual funding(BAU) : low-impact, high-probability event.
- Contingency Funding Plan (CFP): high-impact, low-probability events.
- Relationship with liquidity stress test
- Link the stress test results and other related information as inputs to the CFP governance.
- Liquidity stress testing is helpful to establish limits and escalation levels.
Key design considerations
- Aligned to business and risk profiles
- Aligning the institutions' risk appetite to the CFP framework,through quantifiable EWls, limits, and escalation levels.
- Refresh CFP as the institution's business and risk profile changes over time. Leading institutions develop the CFP to be more forward looking and flexible.
Corporate and business strategies change
New products and services
Macroeconomic and market environments
- Integrated with broader risk management frameworks
- An integrated part of the institution's liquidity risk management and firm-wide risk management frameworks:
Enterprise risk management (ERM)
Capital management
Business continuity
Crisis management
- An integrated part of the institution's liquidity risk management and firm-wide risk management frameworks:
- Operational and actionable, but flexible playbook
- A menu of possible contingency actions that management can undertake in different stress scenarios and at graduated levels of severity.
- As a playbook, the effectiveness of the CFP lies in its operational readiness.
- Inclusive of appropriate stakeholder groups
- Involvement of appropriate stakeholder groups:
Asset liability committee (ALCo)
Risk and capital committee
Investment committee
Business units: Finance, corporate treasury, risk, operations,technology - Ensure internal and external stakeholders to remain confident in the institution's financial strength.
- Involvement of appropriate stakeholder groups:
- Supported by a communication plan
- In any crisis, the coordinated and timely communication of information to stakeholders is critical.
- External communication to clients, analysts, counterparties,and regulators with timely and accurate information is critical.
- Help to reinforce confidence in the institution and mitigate potential risk that rumors, and fears do not further precipitate and adversely impact the institution.
Key components of a CFP framework
- Governance and oversight
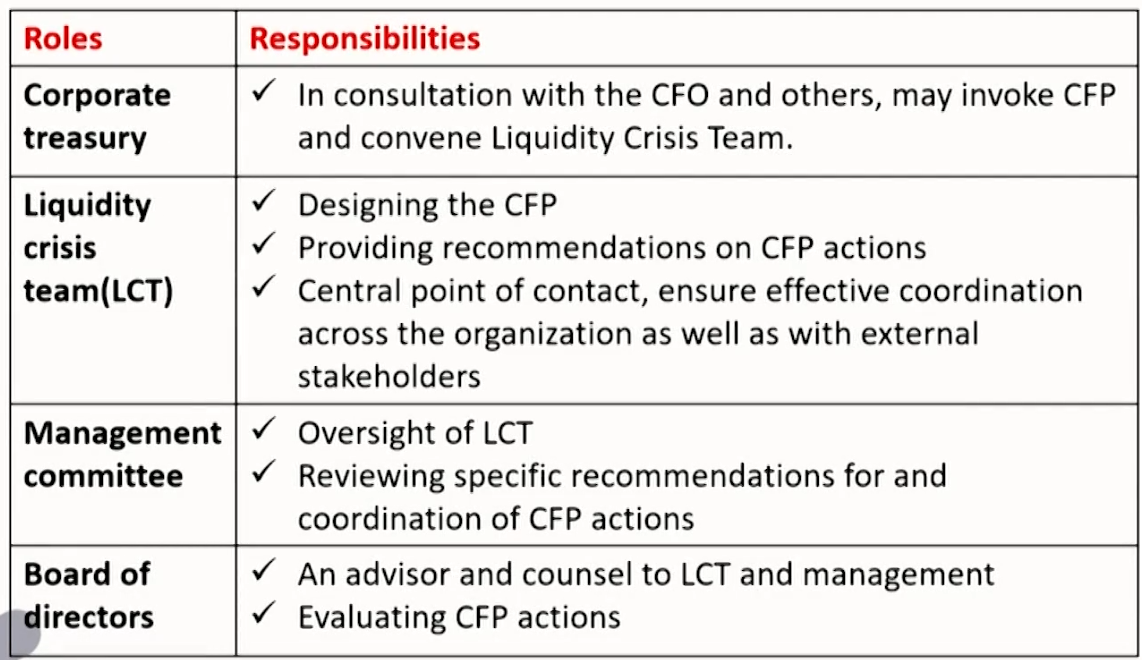
- Scenarios and liquidity gap analysis
- Align the CFP stress scenarios to liquidity stress testing framework, as well as to other frameworks such as the recovery and resolution plans.
- CFP may contain additional liquidity-related stress scenarios.
Intraday debit cap with Fedwire is exceeded
Specific counterparties fail
Federal Home Loan Bank funding becomes unavailable
- Contingent actions: help strengthen the institution's liquidity position.
- Reducing the amount of lending activity
- Offering higher rates on deposits
- Choosing not to reinvest securities when they mature
- Increasing securitization activities
- Disposing of liquid assets
- Issuing subordinated debt
- Disposing of business units
- Monitoring and escalation
- Early warning indicators
- Market and business factors
Spike in market volatility (e.g., VIX) - Liquidity health measures
Projected net funding requirements current unused funding capacity
Non-core funding to long-term assets
Overnight borrowings to total assets
Short-term liabilities to total assets
Funding sources concentration
Funding maturity profile
Used capacity to total borrowing capacity
Liquid assets to volatile liabilities
Unpledged eligible collateral to total assets
Loans to commitments - Escalation Levels: 3 to 5 escalation levels
Level 1: Triggered by stress test results indicating a greater decline in liquidity than the institution's risk appetite targets and/or a shift in the market's perception of the institution.
Level 2: Iriggered when institution experiences noticeable markets and/or idiosyncratic events that are adversely impacting its business and liquidity risk profile. Focus on immediate and short-term horizon
Level 3: Triggered when dramatic steps should be taken to stabilize the liquidity position. Focus on survival.
- Data and reporting
- Reports capture intraday liquidity positions, track exposure to contingent liabilities, and monitor capacity usage in funding sources.
- Reports convey methods used to determine liquidity coverage for upcoming liabilities and funding.
- Increasing the frequency of liquidity management reporting benefit the institution.